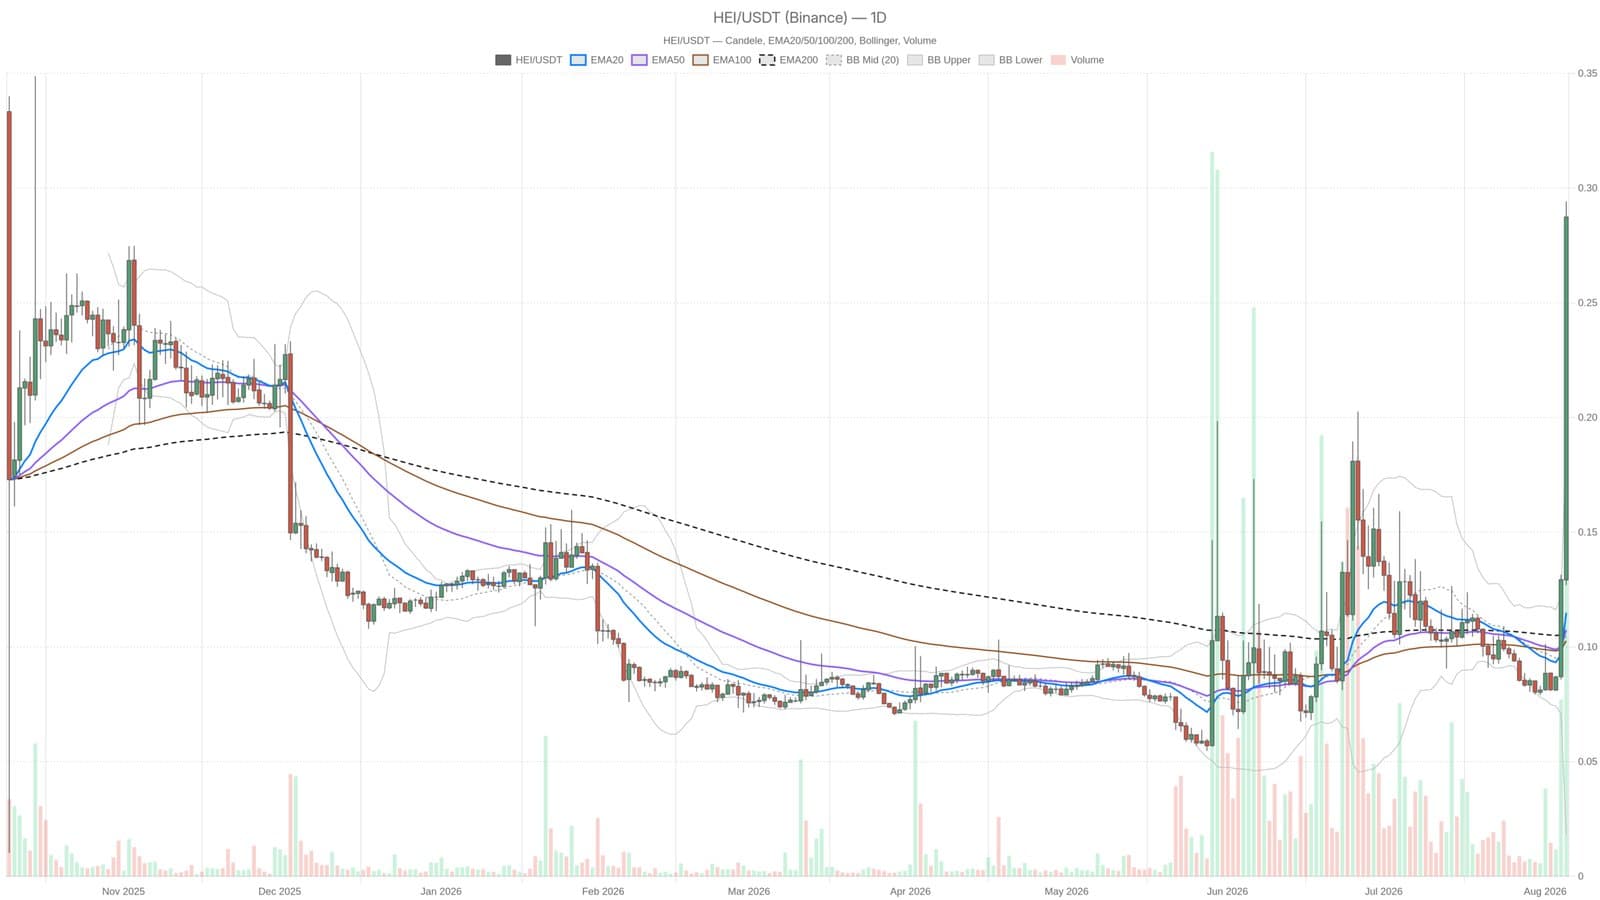
Heima trades at 0.29 as of August 5, sitting 2.6 times above its clustered 20, 50 and 200-period EMAs, all stacked at 0.11. The gap is extreme. Daily RSI screams 85.72, deep into overbought territory, while price sits roughly 0.10 above the upper Bollinger Band at 0.19. This kind of detachment rarely lasts without at least a sharp pullback.
What catches the eye is the isolation. The Fear and Greed Index reads 27, firmly in "Fear" territory, while Bitcoin dominance holds near 56.5% and total crypto market cap sits at roughly 2.295 trillion, up just 0.75% in 24 hours. The broader market is range-bound and cautious, yet Heima is pushing an aggressive, solo rally. That divergence usually signals asset-specific buying rather than a market-wide risk-on rotation.
The technical picture
The daily chart shows a parabolic extension that has completely disconnected from its trend base. With EMA20, EMA50 and EMA200 all at 0.11, price breaking to 0.29 is not a mature uptrend riding its moving averages. It is a breakout in thin air. Daily MACD sits at 0.01 with a signal line near 0, histogram at 0.01, technically bullish but barely. The momentum is real, just not accelerating at these levels.
Where traders watch
Support holds at 0.26 (H1 pivot) and 0.24 (daily pivot). Resistance sits at 0.35. ATR readings of 0.02 to 0.03 point to sharp volatility in either direction, meaning moves could swing hard and fast once the overbought condition breaks. Few assets sustain this kind of extension without shaking out weaker hands first.
This material is informational only and does not constitute financial advice or a recommendation to buy or sell any asset.