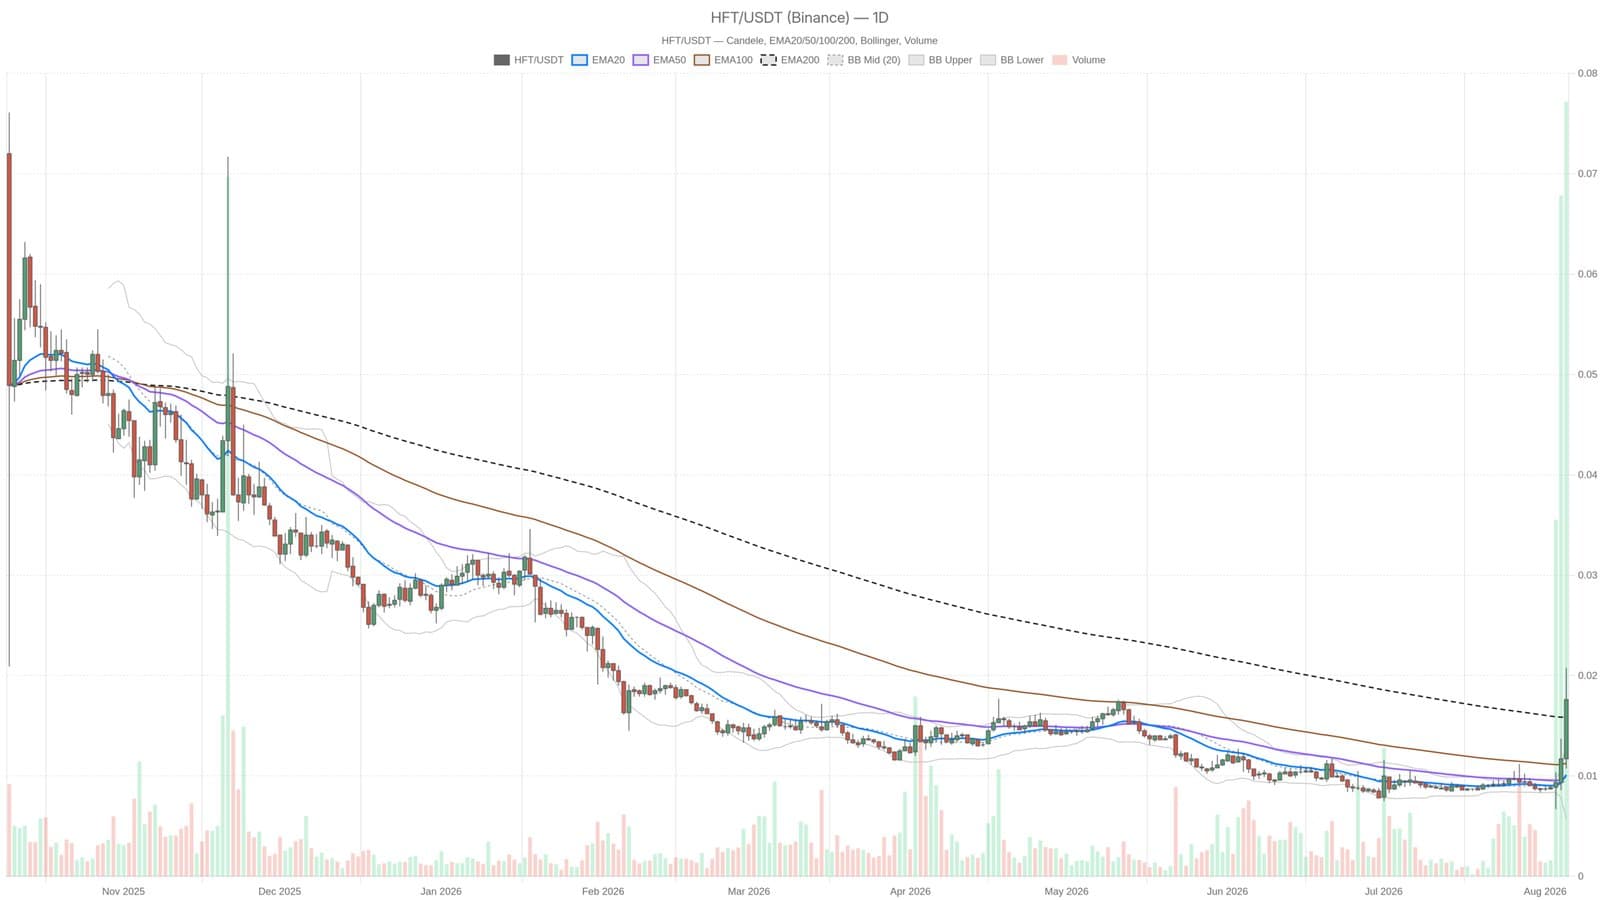
Hashflow (HFT) posted a daily RSI of 87.91 on August 5, 2026, a level that typically warns of exhaustion. Yet the shorter timeframe tells a different story. The 1-hour chart remains bullish with price sitting above its 20, 50, and 200-period moving averages, creating a split between what the daily oscillators scream and what the intraday structure actually shows.
HFT closed at $0.02, holding above both the 20 and 50-period EMAs while essentially aligned with the 200-period average. That stacking pattern is unusual. The short-term moving averages lag well below price while the long-term average has already caught up. It signals a sharp, fast move that simply didn't give shorter averages time to follow along.
The Broader Market Paradox
The tension runs deeper than just one token. Total crypto market cap sits at roughly $2.28 trillion, up a meager 0.47% in 24 hours, while Bitcoin dominance commands 56.67% of the overall value. Meanwhile, the Fear & Greed Index is planted firmly at 27, deep in fear territory. That's the real puzzle: cautious sentiment across the market while a single token shows near-euphoric momentum on its daily chart.
The daily MACD sits flat at zero across line, signal, and histogram. No fresh crossover signal. Bollinger Bands are compressed tightly around $0.01, clustered so close that the upper and lower bands offer minimal breathing room. The move followed a squeeze rather than erupting from an already-expanded range.
Where Support and Resistance Actually Live
Pivot levels place the pivot point at $0.02 with resistance R1 also at $0.02 and support S1 down at $0.01. Price is essentially trading at the key level itself. That narrow band between support and pivot leaves little room for error on either side. Traders watching overbought signals know this setup often ends one of two ways: either a sharp reversal or a consolidation before the next leg higher.
This material is for informational purposes only and does not constitute financial advice. Always conduct your own research before making trading decisions.