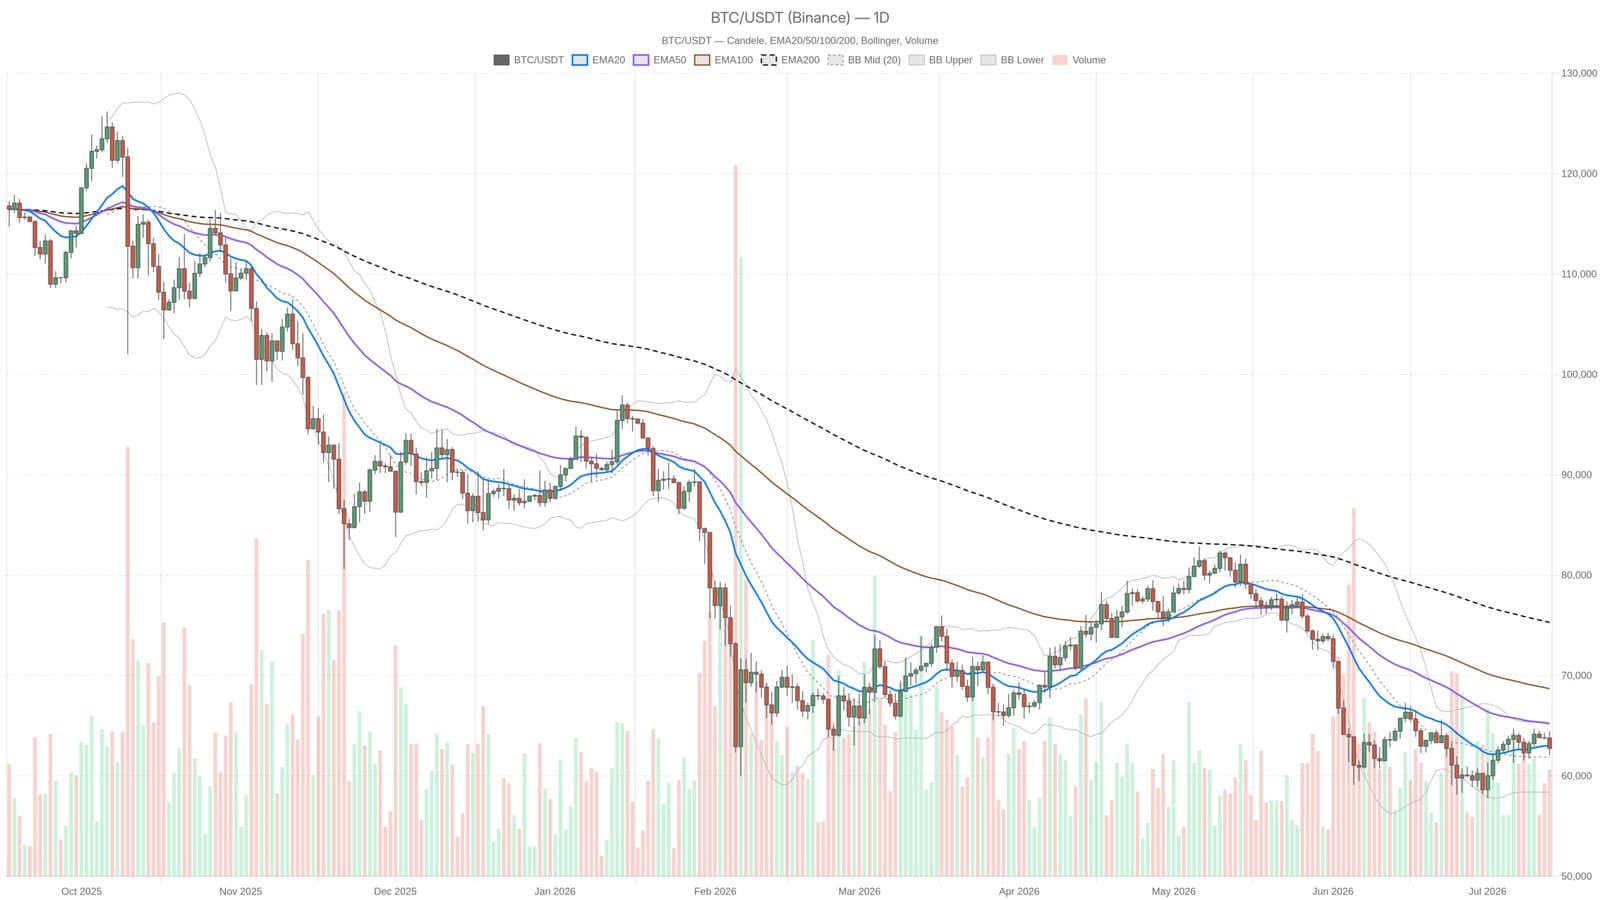
As Bitcoin hovers around $62,734 on July 13, 2026, the market finds itself at a crucial juncture. The persistent price pressure reflects a broader fear among investors, as indicated by the Fear & Greed Index, which sits at a low 28. This sentiment suggests a defensive posture prevalent in the crypto space, raising questions about potential future movements.
Institutional Confidence Amid Market Fear
Despite the bearish trend, institutional confidence remains somewhat intact. Notably, Strategy, the firm led by Michael Saylor, recently bolstered its Bitcoin reserves to $3 billion through a stock sale. This move indicates that large investors are still committed to holding Bitcoin, even as the charts show a structurally weak environment.
The daily Bitcoin chart reveals the cryptocurrency trapped below significant moving averages the EMA20 at $62,965 and the EMA50 at $65,188 both of which have consistently acted as resistance. Furthermore, the EMA200 rests at $75,291, emphasizing the extent of the bearish momentum.
Technical Indicators and Future Outlook
In examining momentum indicators, the daily MACD histogram at +425.95 suggests that bearish momentum may be waning, hinting at a possible exhaustion of selling pressure. However, traders should exercise caution; the MACD divergence serves as a yellow flag rather than a definitive reversal signal.
The challenge ahead is to reclaim the daily pivot point at $63,086 to shift into bullish territory. Failure to do so could pave the way for a decline towards $58,397, which looms as the next critical threshold. As we analyze recent market dynamics and shifts in sentiment, geopolitical tensions and inflationary concerns, particularly influenced by rising oil prices, continue to play a significant role in shaping Bitcoin's trajectory.
This article is for informational purposes only and should not be considered as financial advice.