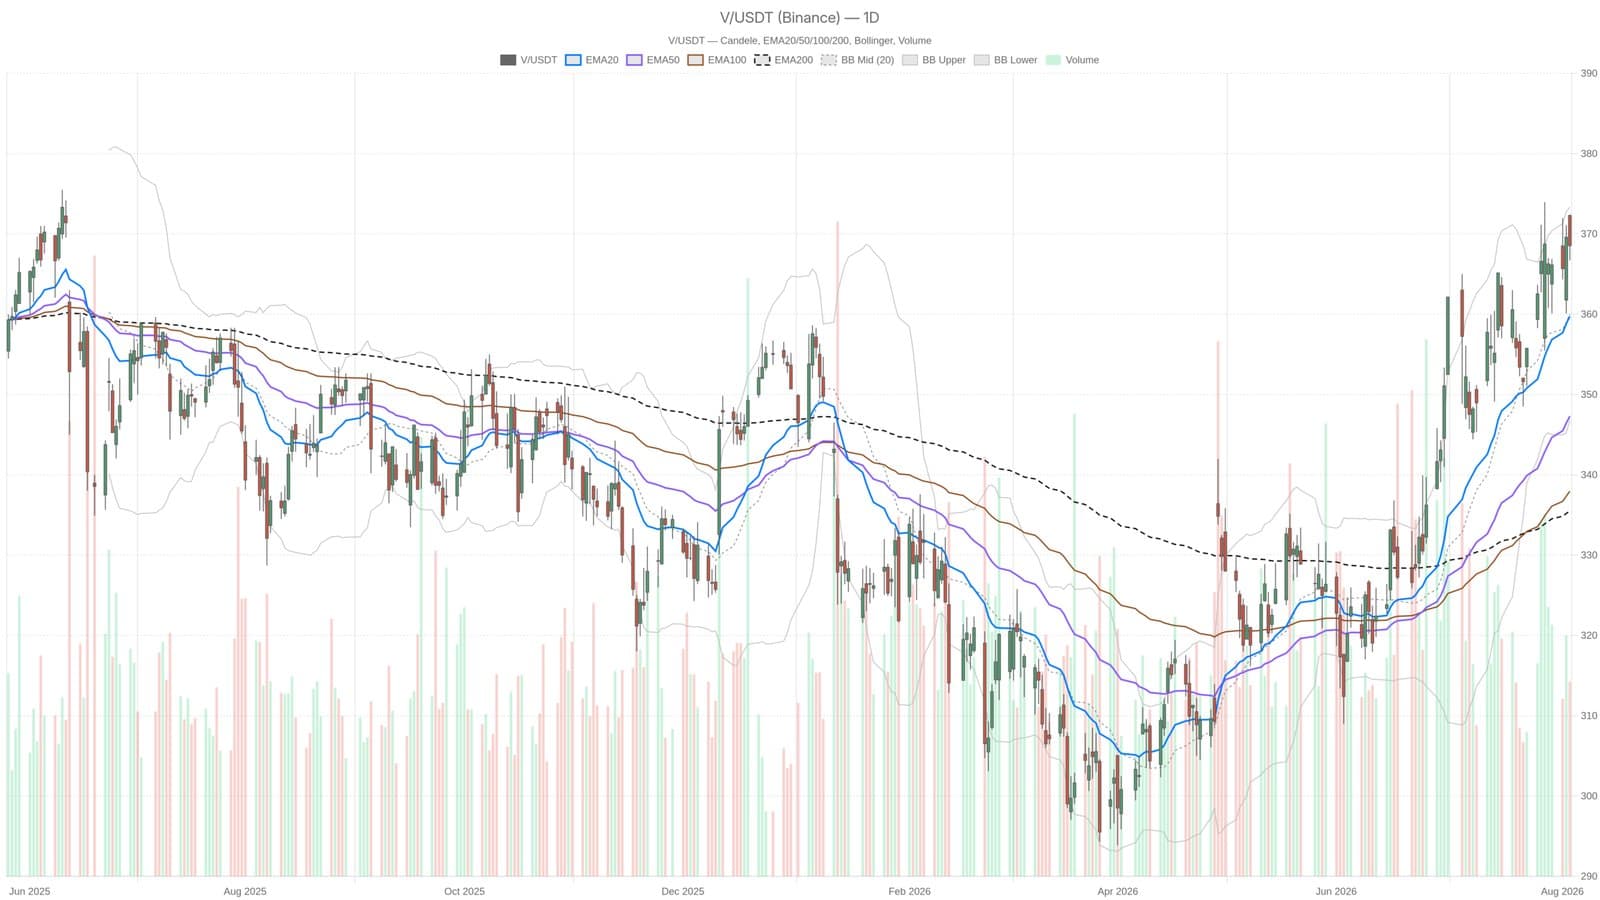
Visa closed at 368.54 on August 5, keeping its head above the 20-, 50-, and 200-day moving averages. The stock is still in an uptrend, but something shifted.
The price bumped against 372.40 during the session, nearly touching the upper Bollinger Band at 373.34. That's the zone where buyers typically back off. The MACD histogram turned slightly negative at minus 0.02, a first signal that momentum is fading, not reversing.
The RSI sits at 64.24, still bullish but nowhere near overbought. That normally leaves room to run higher without immediately exhausting the move. Yet the hesitation near the upper band suggests traders are getting cautious.
On the hourly chart, price at 368.38 remains above all three key moving averages at 367.76, 365.93, and 355.50. The structure is intact for now. But the hourly RSI has climbed high enough to suggest short-term consolidation ahead rather than immediate breakout.
Traders watching the 15-minute timeframe see near-total neutral conditions. RSI sits at 49.51 with almost no volatility, the kind of setup that typically precedes either a quick bounce or a pullback to retest support. No clear direction yet at that micro level.
The daily pivot's first resistance sits at 371.72, sitting right in the path between current price and that upper Bollinger Band. Breaking through cleanly would be needed to confirm the uptrend has more room. For now, Visa is pausing to catch its breath at the top of its recent range.
This material is informational only and should not be treated as investment advice.