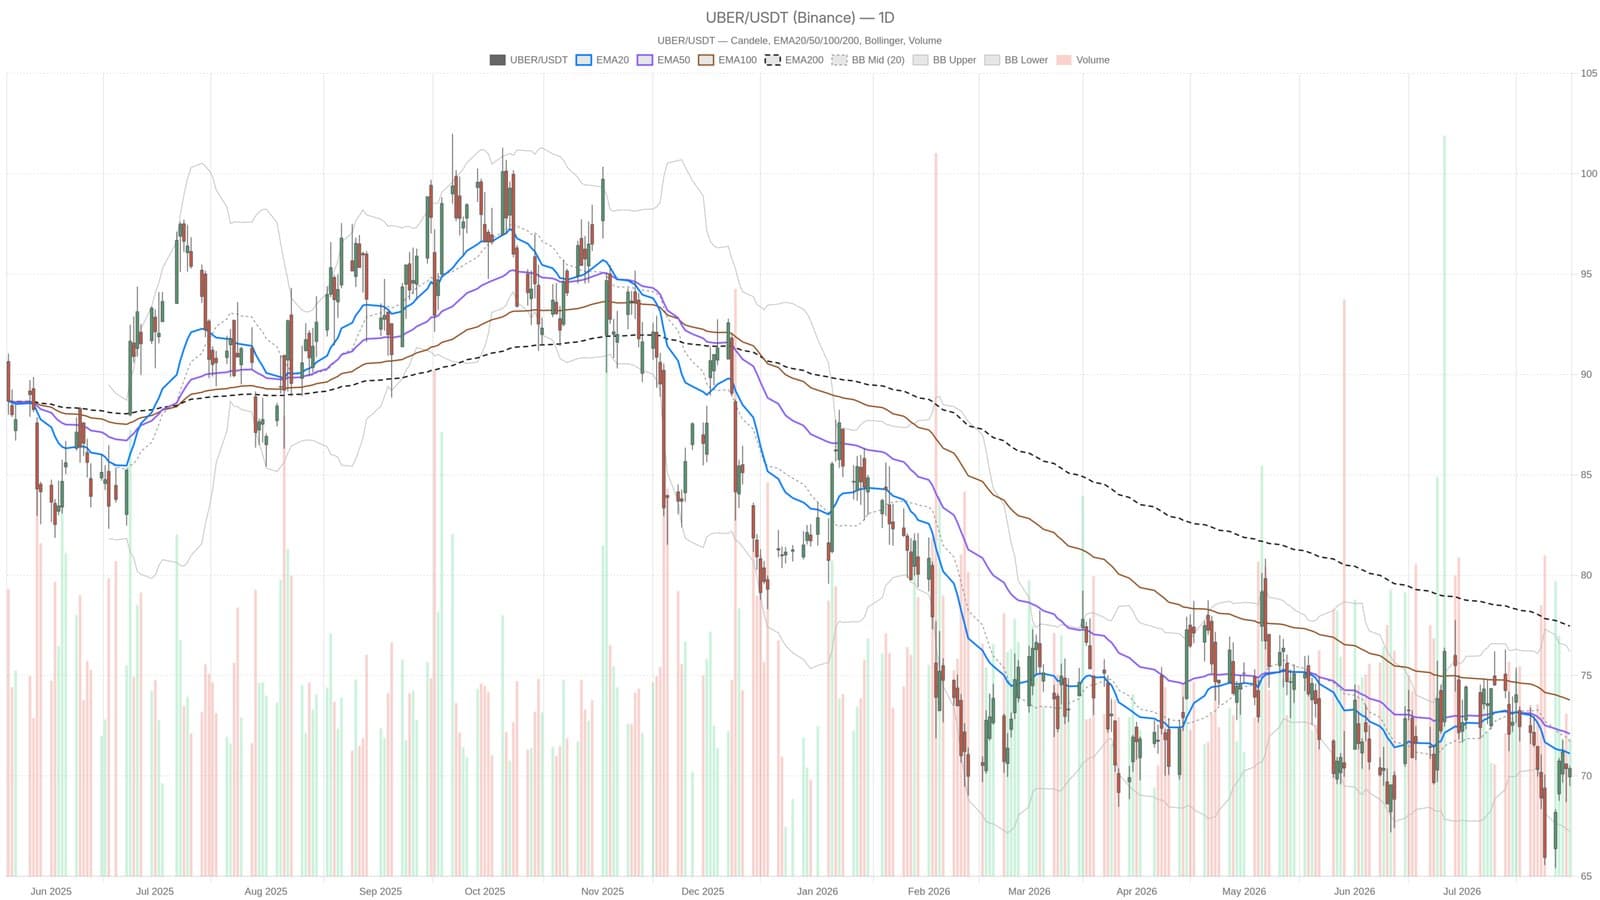
Uber’s share price hovered around $70.36 recently, caught in a tug-of-war between sellers dominating the bigger picture and a smaller wave of buyers pushing it up during the day. It’s a classic technical struggle where the stock refuses to climb above its key 200-day exponential moving average, currently near $77.
On the daily scale, Uber remains stuck under all its main moving averages the 20-day, 50-day, and especially the 200-day EMA. This stacked setup, with prices well below these averages, signals a clear bearish trend. The mechanical indicators back this view up. The MACD stands at -0.79, lower than its signal line at -0.65, which means sellers still have the upper hand.
Zoom into the hourly chart and the scene looks less one-sided. Prices recently reclaimed the 20 and 50 EMAs but haven’t managed to clear the 200-hour EMA yet, which acts as resistance at $71.47. Even shorter-term data from a 15-minute chart shows a stronger bounce with the RSI climbing towards 65.35. This suggests some buying momentum, but it's approaching overbought conditions near $70.56, hinting the rally could stall.
The daily average true range of 2.39 points reveals Uber stock’s volatility is elevated, making sharp moves in either direction possible. If the current bounce fades, the next technical support sits near the lower Bollinger Band at $67.25. This level might be a target for sellers aiming to push prices down further.
There’s a clear divide between the longer-term weakness and shorter-term rebounds for Uber. The stock faces a steep climb ahead to flip the narrative and break above the $77 EMA, which has been a ceiling for some time. Until then, the bears hold sway.
content is for informational purposes only and does not constitute financial advice