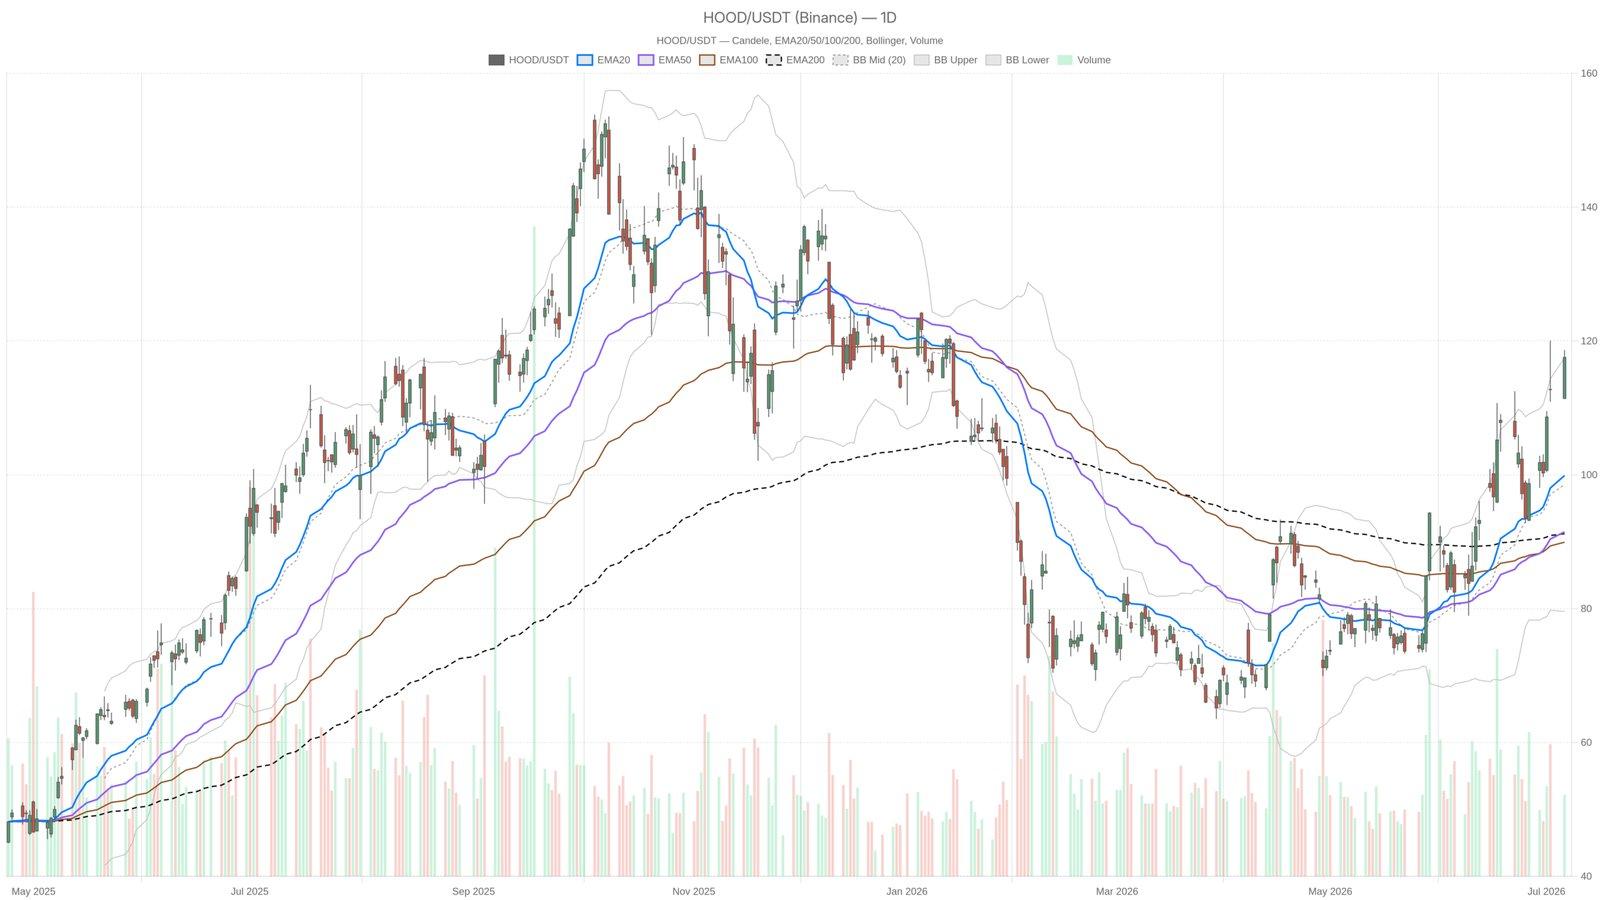
On July 6, 2026, Robinhood's stock price surged to $117.55, traveling from an opening of $111.41 to an intraday high of $118.65. This rise raises critical questions about its sustainability, especially ahead of the anticipated Q2 earnings report.
Why This Matters for Investors
Understanding the dynamics behind Robinhood's recent stock surge is essential for investors. The increase above the upper Bollinger Band indicates potential overextension, often leading to mean-reversion pressures if momentum fails to hold. Here are key indicators to consider:
- Current closing price: $117.55
- RSI nearing overbought territory at 69.87
- Volume reported at 25.39 million shares
- Next resistance level: $120.33
The RSI approaching 70 tends to signal a market correction as it indicates an overbought condition. Coupled with a historical precedent of mean-reversion following Bollinger Band breaches, investors must assess the risk of entering at this juncture.
The Context of Q2 Earnings Expectations
The upcoming Q2 earnings report is flagged to reveal a potential double-digit decline. This anticipated downturn inherently raises concerns, creating a juxtaposition of challenging fundamentals against the backdrop of strong product catalysts highlighted in Robinhood's London keynote presentation. Despite the bullish technical indicators, market sentiment could turn cautious as the earnings report approaches.
What Lies Ahead?
As Robinhood moves forward, key factors to monitor include:
- The Q2 earnings report and its impact on market perception
- Price behavior in relation to the pivot support level at $113.09
- General market conditions influencing trading volumes
Understanding these elements will be vital in navigating potential volatility and assessing bullish versus bearish momentum accurately. Investors should remain alert to the balance of technical indicators against fundamental outlooks.
This material is for informational purposes only and should not be considered financial advice.