Alphabet's stock took a beating after the company reported negative free cash flow in the second quarter, wiping out double-digit gains in a single session. The earnings miss collided with a leadership shake-up at DeepMind, leaving investors scrambling to reassess the tech giant's near-term trajectory.
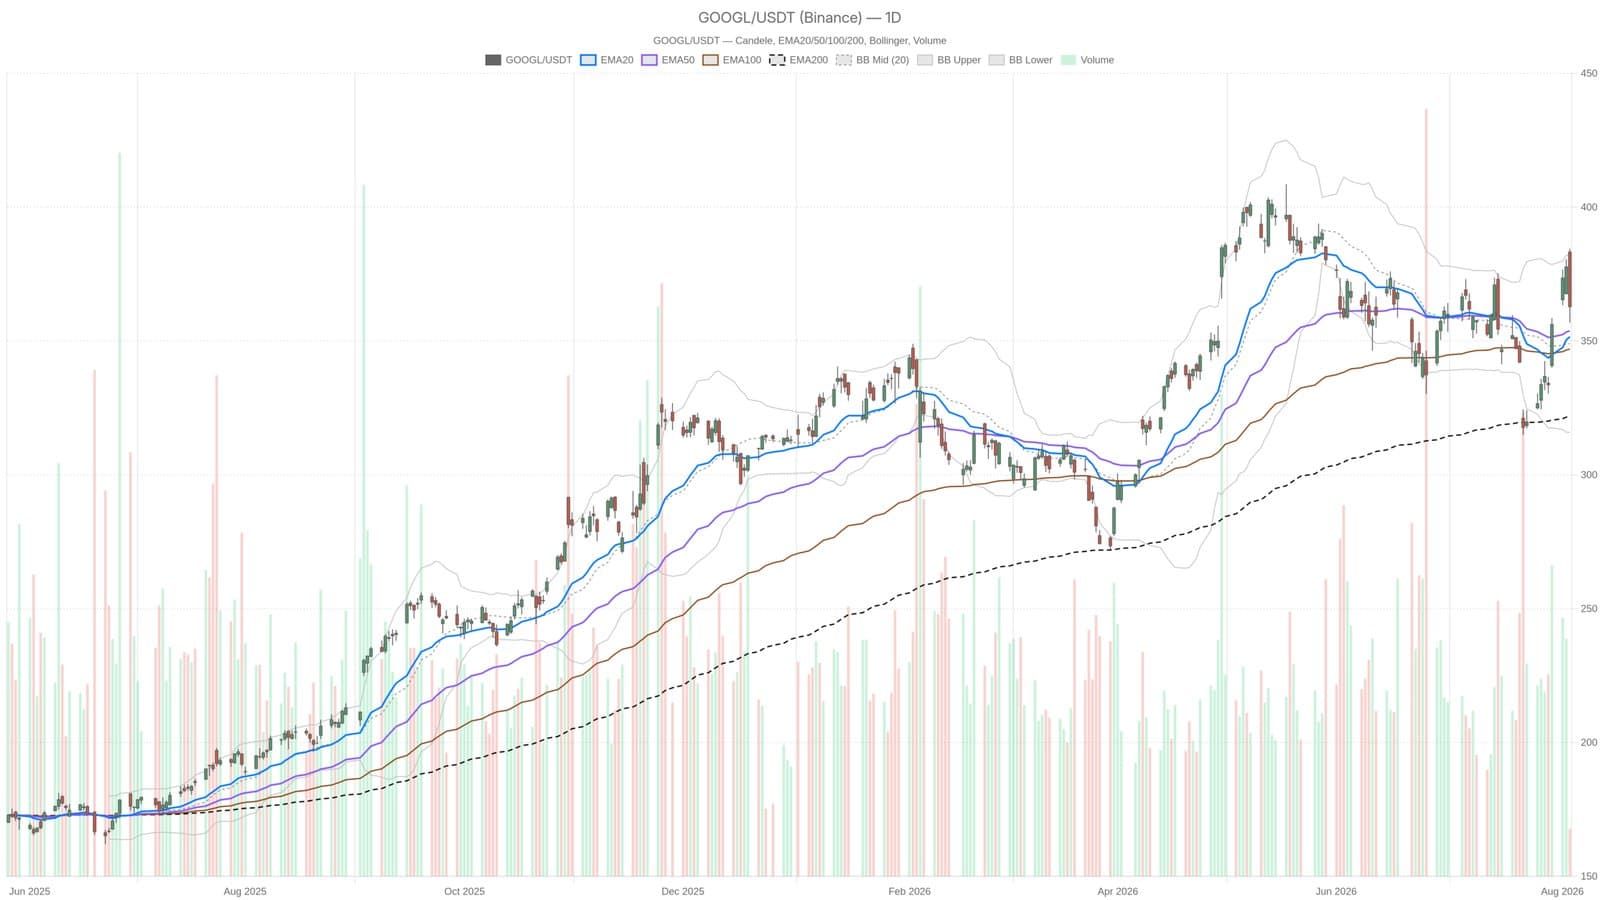
The daily candle tells the story. Price opened at 383.19, climbed briefly to 384.44, then collapsed to 356.83 before settling at 362.84. That wide, bearish-shaped range signals genuine stress in what had been a steady uptrend. The close sitting well below the session high is hardly reassuring for bulls.
Structure under pressure, but not broken yet
Despite the carnage, the longer-term technical setup hasn't folded. Alphabet remains above the EMA20 at 351.61, the EMA50 at 353.75, and the EMA200 at 321.95. That alignment still points to an uptrend that, while battered, hasn't been invalidated on the daily timeframe. Momentum indicators are sending mixed signals. RSI14 sits at neutral 54.77, neither overbought nor oversold. MACD shows a positive histogram of 4.34, though that strength likely reflects buying pressure from before the drop rather than fresh conviction.
Volatility has spiked hard. ATR14 jumped to 14.19, confirming that the price swings have expanded sharply alongside the news flow. On the hourly chart, MACD has already turned bearish, suggesting short-term momentum has rolled over. Price is also sitting below the daily pivot point at 368.04, a sign that near-term distribution may be accelerating.
The Bollinger Bands paint a similar picture. The mid-line sits at 348.98, with the upper band at 382.11 and the lower band at 315.86. Price is trading in the upper half of that range, but the recent drop has tightened the technical margin for error. Traders are now watching whether support at the EMA50 holds or if the selling pressure cascades lower.
This material is for informational purposes only and should not be construed as financial advice or a recommendation to buy or sell any security.