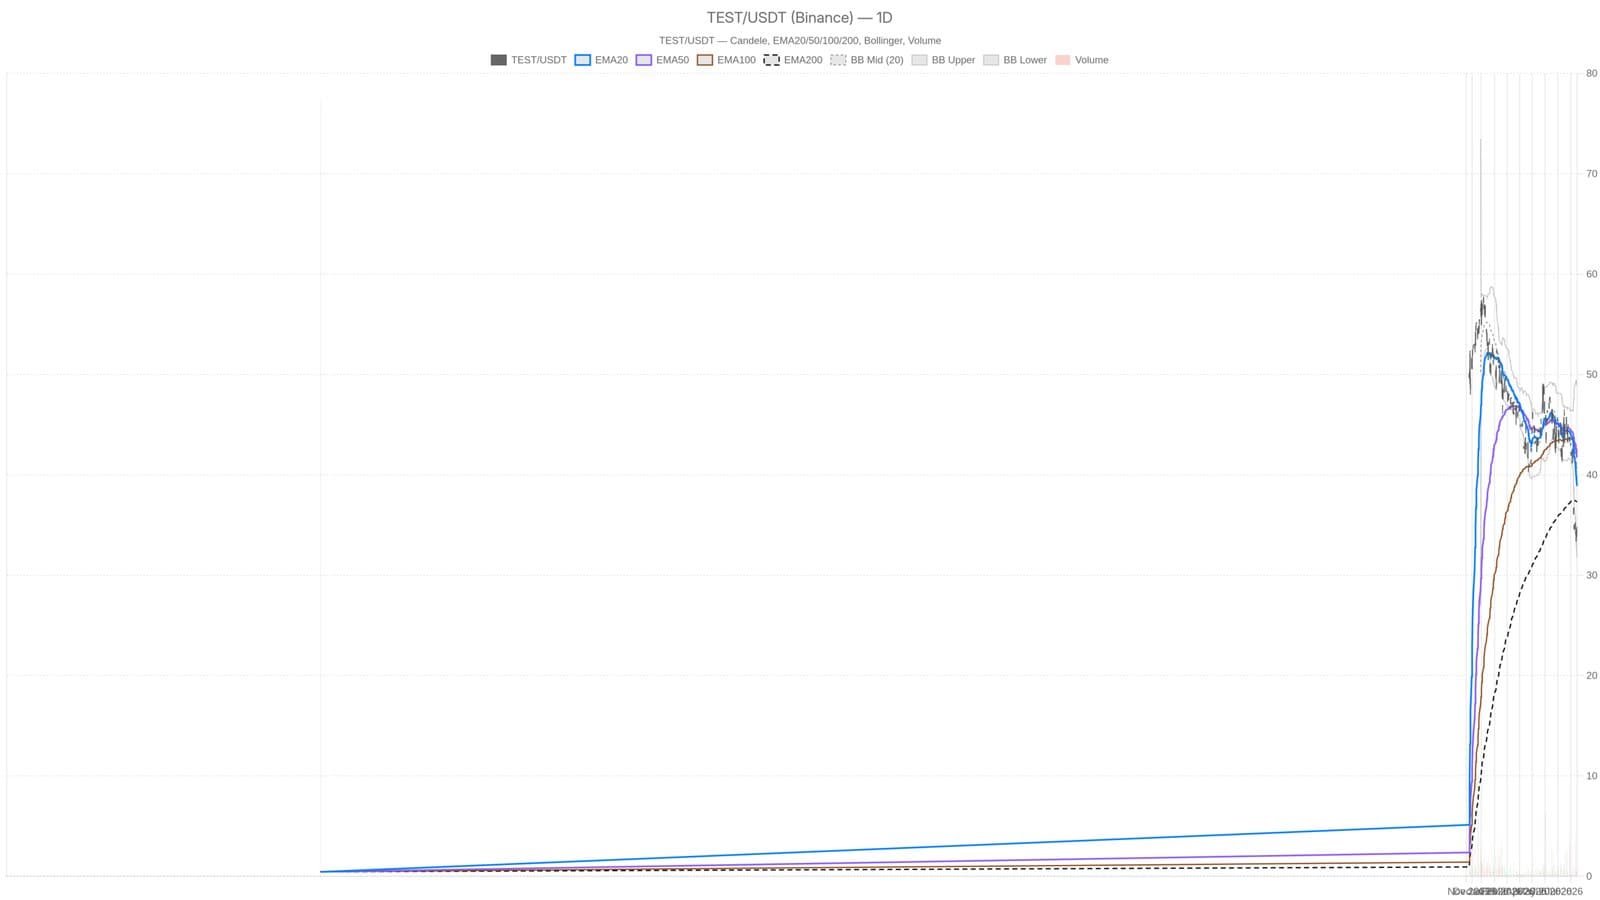
TSLA Performance & Dis stock dropped to 34.77, closing below all key exponential moving averages: EMA20 at 38.89, EMA50 at 41.76, and EMA200 at 37.30. This setup clearly indicates a strong bearish trend in place. However, short-term momentum hints at some early stabilization as the MACD histograms on 1-hour and 15-minute charts turn positive, showing values of 0.40 and 0.30 respectively.
Oversold Conditions Signal Selling Pressure but No Immediate Reversal
With the daily Relative Strength Index (RSI14) plunging to 29.96, the stock is deeply oversold. While such levels often suggest a potential bounce, in this case, the persistent downtrend makes a swift reversal uncertain. The technical indicators together paint a picture of aggressive selling pressure, reinforced by the MACD line sitting at -2.70 below its signal line at -1.97 and a negative histogram of -0.73.
Price is compressed tightly near the pivot point at 34.62, caught between support at 34.47 and resistance at 34.91. Bollinger Bands place the stock well below the mid-band of 40.29, confirming a stretched move to the downside rather than smooth consolidation. The average true range over 14 days (ATR14) is 1.12, indicating moderate volatility and manageable price swings.
This technical tension reflects a stock caught in a battle between ongoing bearish momentum and signs of short-term stability. Traders monitoring TSLA Performance & Dis should watch pivot zones closely as these could dictate the next directional move.
This material is for informational purposes only and does not constitute financial advice.