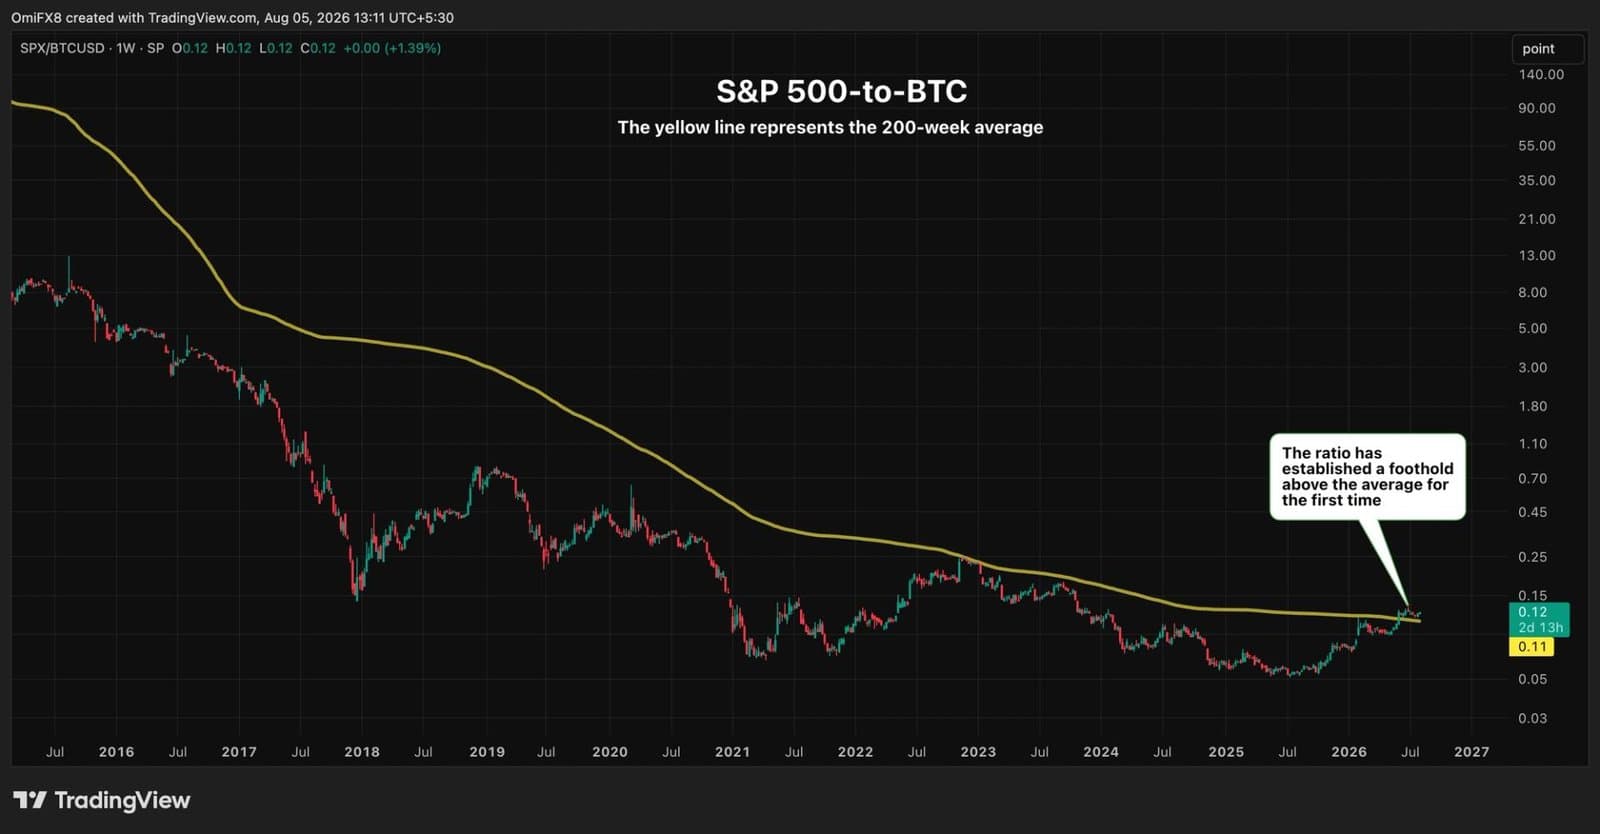
The S&P 500 just did something it never managed before. For the first time since bitcoin's birth in 2010, stocks priced in cryptocurrency have climbed above their 200-week moving average and stayed there. The Nasdaq shows the same breakout. Both charts are flashing a signal that could reshape how investors think about crypto's role in their portfolios.
To own the entire S&P 500 today costs roughly 0.12 bitcoin. Back in 2012, it took over 300 BTC. That ratio has been bitcoin's scorecard against equities, and for 14 years it moved only one direction: down, meaning bitcoin was winning the race. The 200-week average acted like a ceiling every time stocks tried to break higher. Every. Single. Time. Until now.
What the Break Means
The shift matters because it signals the end of something bulls have relied on for over a decade. Bitcoin's entire narrative rested on outperformance. Supporters pointed to those outsized gains as proof it was the superior store of value, the asset that would lift a portfolio on its own. When global stocks rally and crypto gets left behind, that edge erodes fast.
The ratio holding above the long-term average suggests bitcoin's era of parabolic rallies versus equities has likely closed. If stocks can now compete with crypto on a risk-adjusted basis, the bull case weakens. Aggressive forecasts predicting $300,000 bitcoin or higher rely on the old playbook, where a small asset class could multiply many times in months. That math breaks down if bitcoin behaves more like traditional equities.
For macro traders, this changes the calculus entirely. A cryptocurrency that no longer decisively outperforms stocks loses its primary appeal as a portfolio accelerator. The narrative shift could matter more than the price itself.
This article is for informational purposes and does not constitute financial advice. Past performance does not guarantee future results.