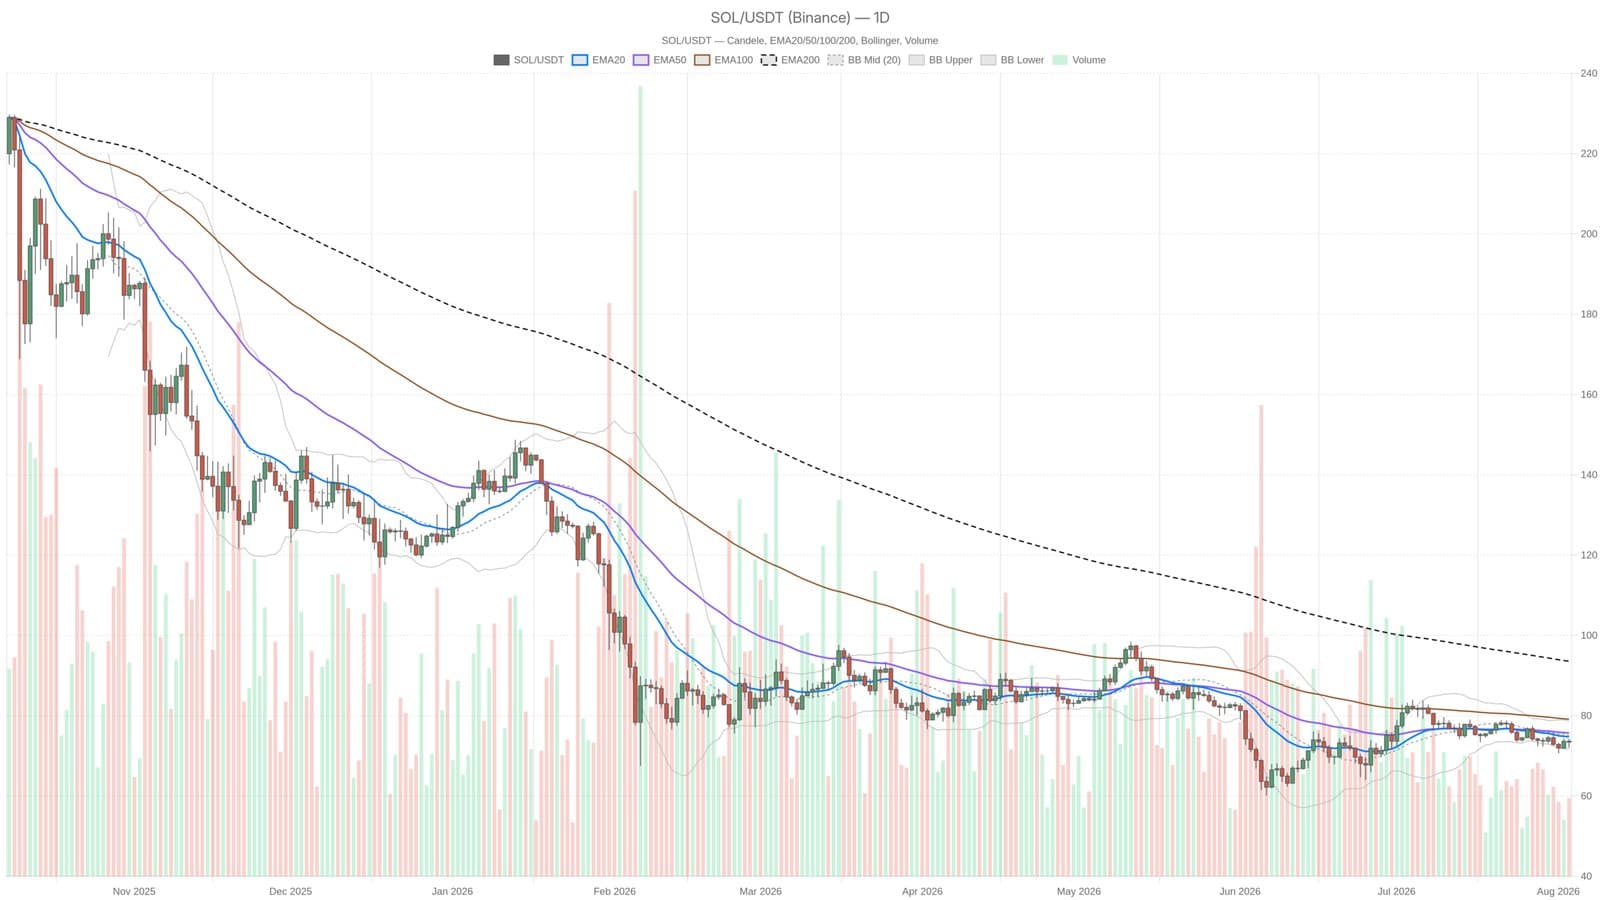
Solana is holding its ground near $73.44, but the pressure from above remains relentless. "The Fear & Greed Index is screaming fear at 28, and with Bitcoin hogging 56.37% of the market's attention, altcoins like SOL are getting squeezed," said one trader monitoring the daily action. The coin sits stubbornly below every major moving average, a pattern that usually takes time to break.
The daily chart tells a story of weakness that hasn't quite bottomed. SOL trades below the EMA20 at $74.74, the EMA50 at $75.7, and sits nearly $20 beneath the EMA200 at $93.55. The MACD histogram is still negative and widening, which means sellers haven't lost their grip. RSI at 44.91 offers no relief, hovering in neutral territory. Price is pinned to the lower half of the Bollinger Bands, with support only at $71.64 and resistance clustered tightly at $74.74 to $75.7. Until SOL breaks above that zone, any bounce is just noise in a downtrend. The daily pivot sits almost exactly at current price, $73.23, a setup that usually breeds indecision before the next move.
What's interesting is the activity happening on Solana's DEX platforms. Raydium surged 87.22% in daily volume, while HumidiFi exploded 117.56% over the past week. Despite the price weakness, traders are actively shuffling tokens and executing swaps on the network. The friction costs for these transactions have climbed noticeably, suggesting genuine activity underneath the price action. It's a disconnect worth watching, one that mirrors the pattern of rising daily users while SOL price stalls. On shorter timeframes, MACD and moving averages are tightening up, signaling some consolidation building, but the bigger picture remains a bear market until proven otherwise.
This analysis is for informational purposes only and should not be considered financial advice. Always conduct your own research before making trading decisions.