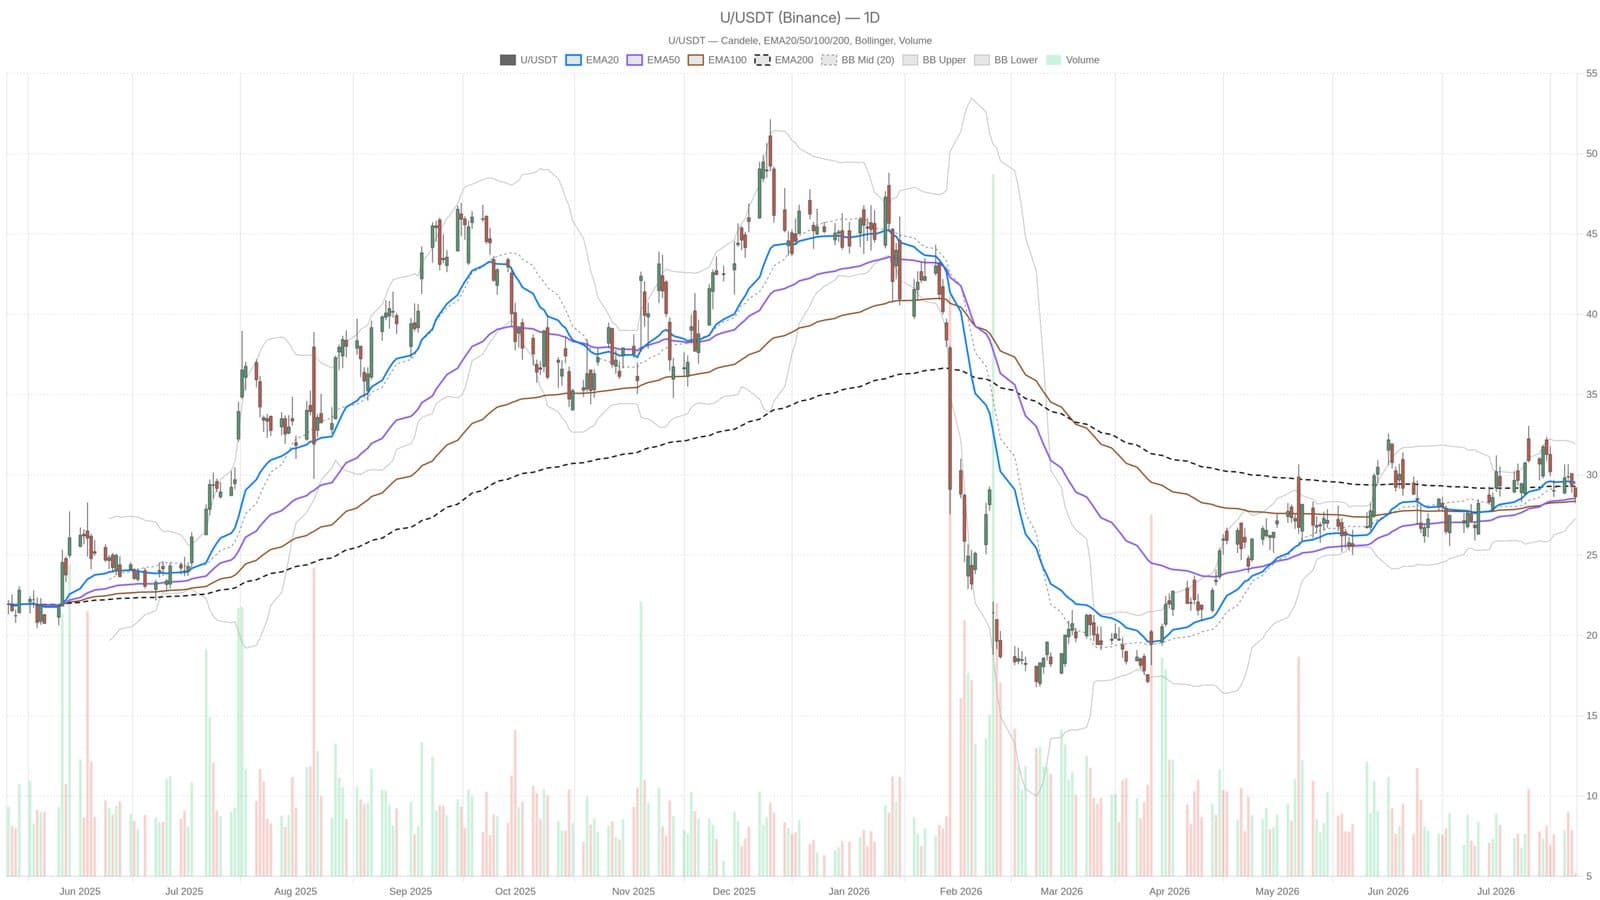
Ubo stock closed July 23 at $28.64, opening the session at $29.19 and never trading a single tick above that open. The high matched the open exactly. That kind of intraday rejection, sellers arriving at the first tick and never letting price breathe, tends to say more about a stock than a week of sideways drift.
The backdrop didn't help either. Oil surged on the same day, the Dow shed 500 points, and risk assets broadly took the hit. For a stock already sitting below its EMA20 ($29.48) and EMA200 ($29.28), the macro timing was poor. EMA50 at $28.52 still sits below the closing price, giving the bulls one last thin ledge to stand on, but the gap is roughly twelve cents. That closes fast when volume picks up on the sell side.
Where the Charts Point From Here
The daily RSI at 46.47 hasn't reached oversold territory yet, but it's been drifting below the 50 midline long enough that the drift itself becomes the signal. The MACD histogram flipped negative to -0.22, with the signal line at 0.58 running above the MACD line at 0.36. A quiet crossover, but it's held. Bollinger Bands put the midline at $29.61 and the lower band at $27.30. Price is already pressing into the lower half of that range, and the ATR of 1.57 means this stock covers real ground when it moves. Daily pivots place the nearest support at $28.19, resistance at $29.14.
Drop to the hourly chart and the picture sharpens considerably. Ubo trades below every major EMA on the 1H timeframe, a clean bearish stack that leaves very little for bulls to argue with. That kind of alignment across both the daily and hourly doesn't reverse quietly. It usually takes a volume event or a sector catalyst to break it, and neither is visible on the tape right now. Stocks in similar technical positions this week, like Trade Desk sitting near multi-year lows with Wall Street divided, show just how long a bearish EMA stack can persist before a genuine bid emerges.
If EMA50 at $28.52 gives way, the next logical destination is the Bollinger lower band at $27.30. That's 4.7% below Wednesday's close, and with the daily regime technically neutral but every sub-indicator pointing down, the label feels like a lag. The daily chart calls it neutral. The price action calls it something else.
This article is for informational purposes only and does not constitute financial advice or a recommendation to buy or sell any security.