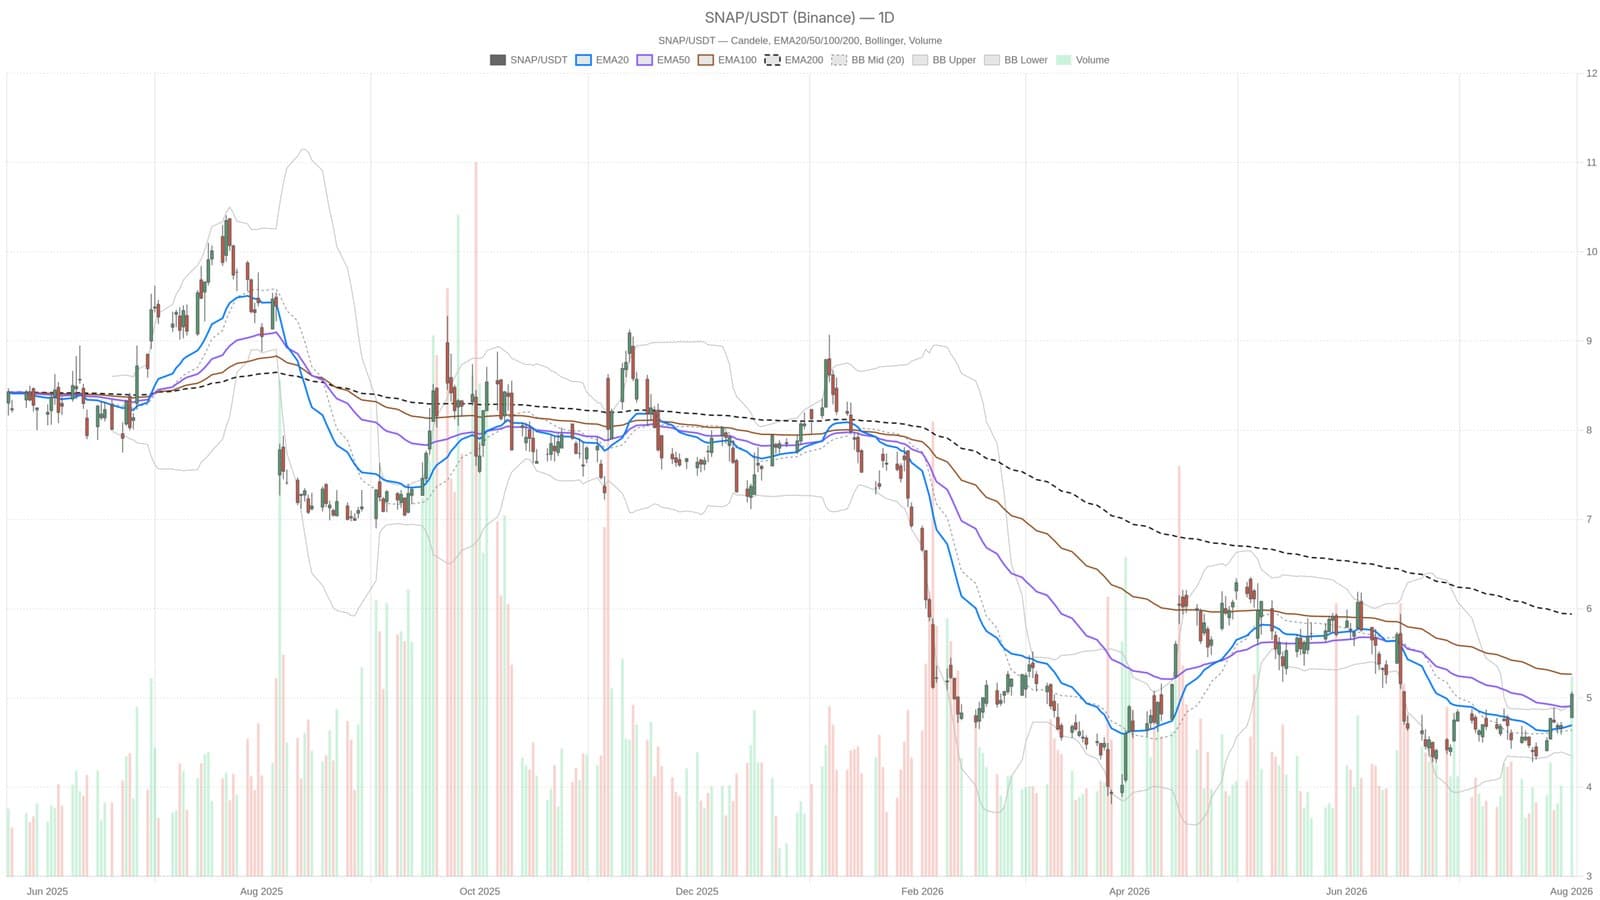
Snap shares jumped 5% on August 3, closing at $5.04 after Q2 revenue climbed 19% year-over-year. The pop looked sharp on the charts. Price broke above the daily upper Bollinger Band at $4.93, signaling fresh momentum off the earnings beat. After-hours trading pushed the stock even higher alongside names like PLTR and ON.
Short-term bounce, longer-term headwind
The rally came off solid numbers. Q3 guidance landed at $1.70 billion to $1.74 billion, and traders responded with conviction. Daily RSI14 hit 60.76, comfortably bullish but not yet overbought. The MACD histogram flipped positive at 0.07, though the line itself stayed negative at -0.04, hinting at transition rather than confirmation.
But there is a catch. The EMA200 sits at $5.94, well above current price. That gap matters because it shows the broader daily trend remains structurally bearish, even as short-term momentum ticks up. Price trades above both the EMA20 and EMA50, which is constructive for the bounce, but the distance to the 200-day average means this looks more like a relief rally than a real reversal. The hourly RSI14 at 75.39 also flags near-term exhaustion risk, suggesting the move may have already run its course.
The real question for traders is whether this earnings beat marks a genuine shift or just another news-driven spike inside a longer downtrend. The technicals lean toward the latter. Price would need to close sustainably above $5.94 to signal a confirmed trend change. Until then, the rally has room to breathe, but the structural ceiling looms large.
This analysis is informational only and does not constitute financial advice. Trading and investing carry inherent risks. Always consult with a qualified financial advisor before making investment decisions.