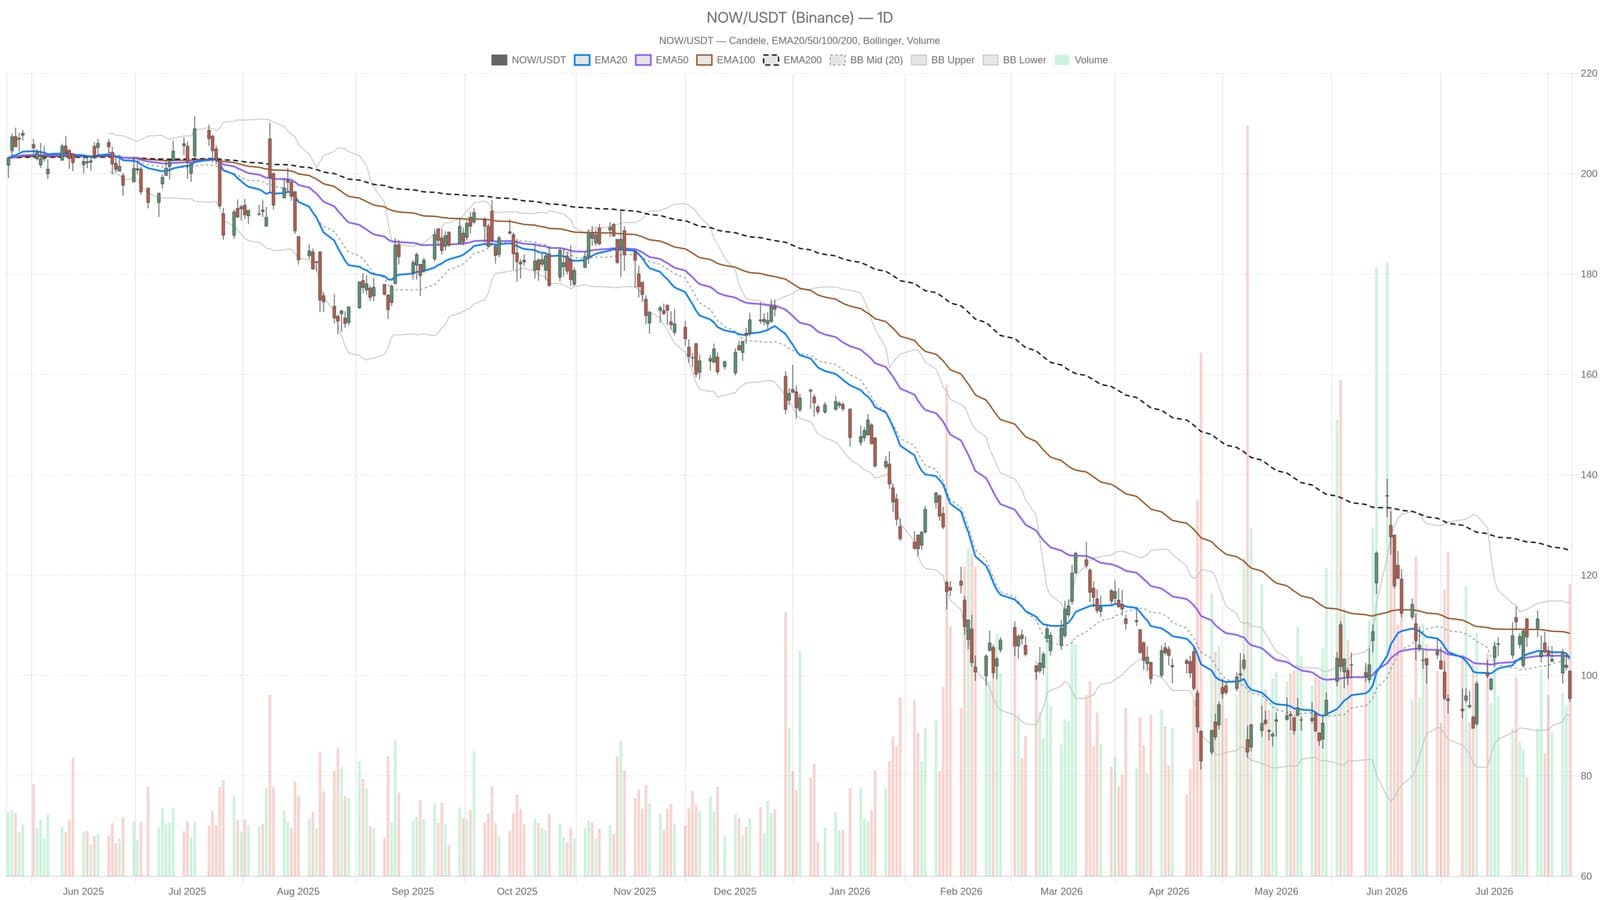
Shares of ServiceNow closed at $95.46 on July 22, even as the company posted a Q2 2026 earnings beat that cleared analyst estimates by 4.65% on the bottom line and 1.65% on revenue. The stock hit an intraday high of $101.01 before sellers took over, dragging price down to a session low of $94.74. That six-point range matches the ATR14 reading of 5.85, a sign the market is still working through the implications of the report.
The fundamental picture is genuinely strong. Revenue grew 24% year-over-year, and management lifted its full-year outlook. In any other technical environment, that combination would have sent the stock higher. Instead, NOW sits roughly 30% below its EMA200, which stands at $124.88. That gap is not a dip. It reflects a stock that has been in a structural downtrend for long enough that a single good quarter cannot close the distance.
What the charts show
The daily EMA structure leaves little room for optimism. EMA20 and EMA50 have nearly converged, both sitting at $103.55 and $103.56 respectively, well above current price. The daily RSI14 is at 39.49, approaching oversold territory but not yet there. MACD is printing a histogram of -0.86, with the line at -0.37 and signal at +0.49. No crossover, no bullish divergence, nothing that suggests a reversal is forming on the daily timeframe.
Bollinger Bands place the lower band at $92.11 and the upper at $114.52. Price is hugging the lower half of that channel, well beneath the midpoint at $103.32. The pivot point is at $97.07. R1 is $99.40. S1 is $93.13, and a daily close beneath that level would push the bearish structure further without any obvious technical floor in sight.
On the hourly chart, conditions are even more stretched. RSI14 on the 1H collapsed to 26.59, firmly in oversold territory, as of 15:30 on July 22. That is not a recovery signal on its own. Oversold can stay oversold in a downtrend, and with bearish EMA alignment confirmed across every timeframe, the burden of proof sits squarely with the bulls.
The disconnect between a 24% revenue grower with an upgraded outlook and a stock trading at $95.46 is the central tension here. Until price reclaims at least the $103 area, where EMA20 and EMA50 are clustered, the technical picture does not change.
This article is for informational purposes only and does not constitute financial or investment advice.