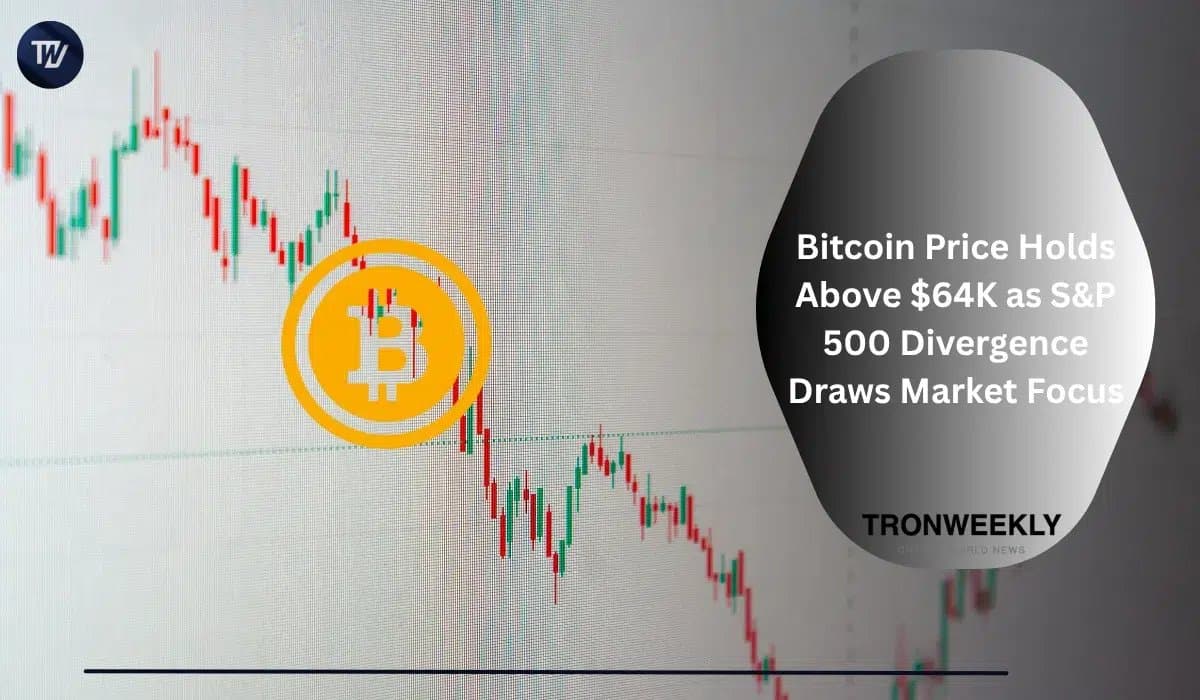
Bitcoin is treading water around $64,375 as something unusual unfolds in the markets. The cryptocurrency has decoupled from the S&P 500 to a degree not seen in years, even as equities and a weakening dollar would normally support risk assets. Analyst Ted flagged the divergence on X, calling it the "largest between S&P 500 and BTC in years," and noting a catch-up trade will eventually happen.
The Numbers Tell a Cautious Story
On the chart, Bitcoin is holding above its 50-day moving average at $63,292, which means buyers are still defending this level. The problem is the 200-day sits way up at $70,696, leaving the broader trend in bearish territory. The MACD histogram has flattened considerably, suggesting selling pressure is easing off. A push above $68,100 would shift momentum bullish, but a drop below $63,300 would kill the current setup.
Gold is surging to six-week highs while Bitcoin treads water, which shows how fragmented the risk-on narrative has become. Spot Bitcoin ETFs pulled in $211.49 million in daily net inflows according to SoSoValue, bringing total assets under management to $78.26 billion. That's substantial. Open interest sits steady around $48-49 billion on derivatives desks, and liquidation activity has cooled compared to earlier spikes.
Institutions Buying the Dip, But Quietly
Institutional money is still trickling in despite the sideways grind. The ETF flows show investors are willing to accumulate during consolidation, which is the kind of behavior you see before breakouts. But the divergence from equities is the real story here. Nasdaq and S&P 500 futures are climbing, the dollar is weakening, and historically that combination supports everything risky. Bitcoin should be rallying harder. It's not. Whether that's a sign of weakness or just a setup for the catch-up trade Ted mentioned remains unclear.
This article is informational only and does not constitute financial advice. Crypto markets are volatile, and past performance does not guarantee future results.