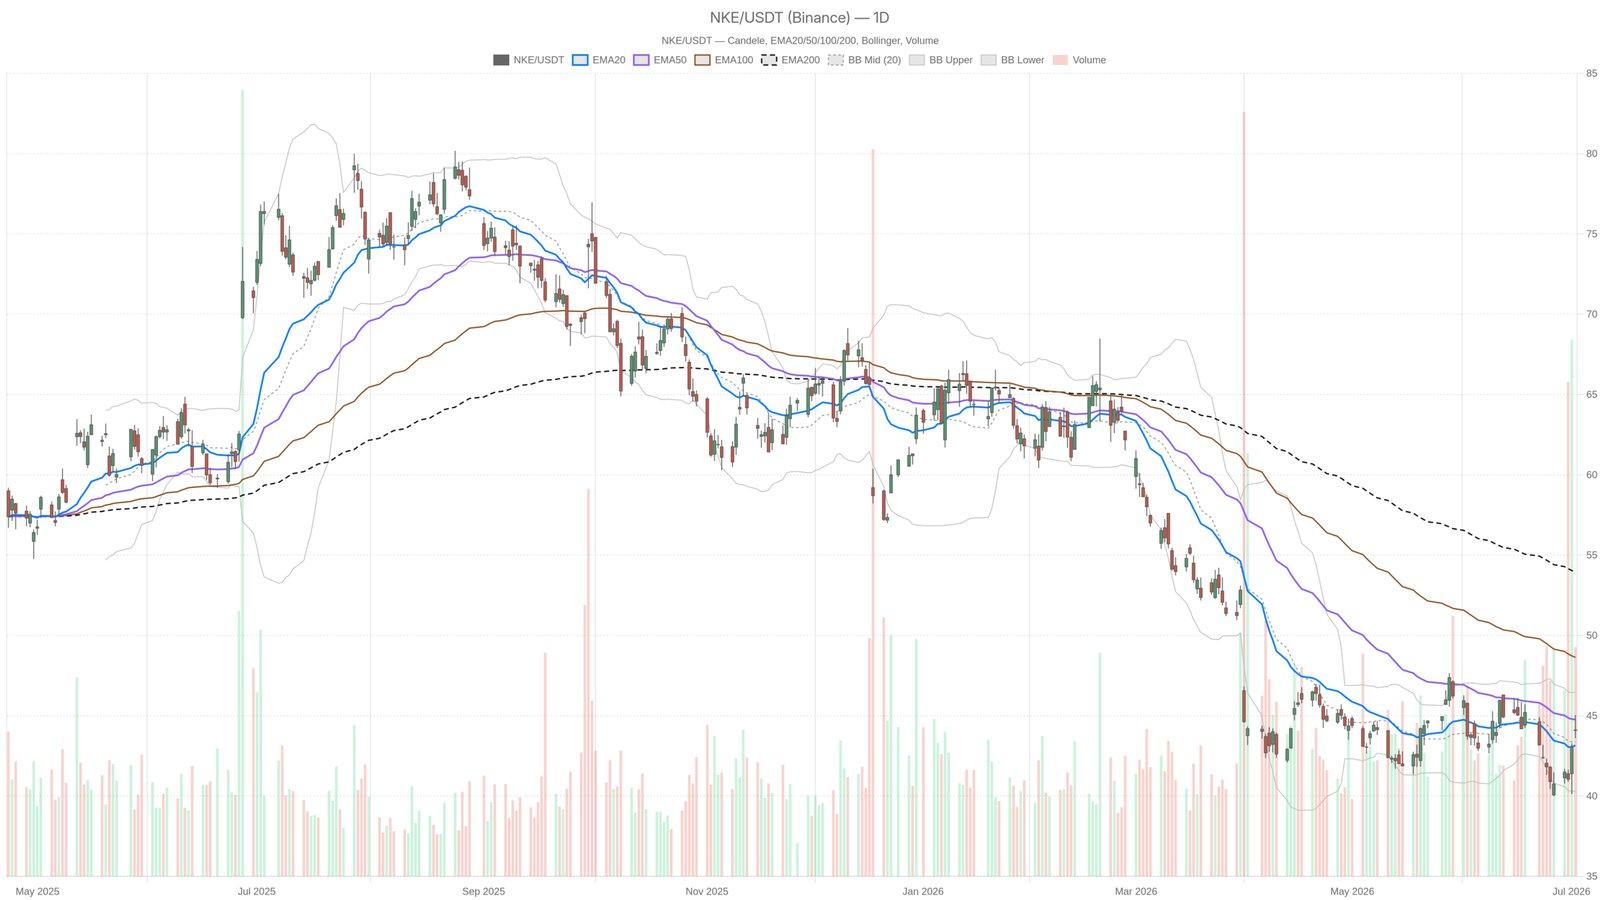
The recent performance of Nike's stock (NKE) serves as a significant indicator of broader market sentiments and challenges faced by large-cap companies. After bouncing back from a low around $40, which marks its 52-week low, NKE closed at $44.09. This recovery, however, raises critical questions about the sustainability of the rebound as it faces an imminent resistance level at $44.76.
Resistance Levels and Market Sentiment
The challenge posed by the daily EMA50 at $44.76 looms large as it represents a potential ceiling for the current recovery. While the stock's recent uptick is promising, it does not fully mitigate the structural damage indicated by the distance to the EMA200, located significantly higher at $53.94. This disparity emphasizes that despite the short-term recovery, a long-term rebound appears unlikely unless NKE decisively breaks through the $44.76 ceiling.
Technical Indicators and Their Implications
The daily MACD remains in negative territory, albeit showing signs of convergence, hinting at potential fatigue in selling pressures but not yet indicating a definitive trend reversal. Furthermore, momentum indicators suggest that while selling pressure is easing, there is an absence of strong bullish signals, indicating that NKE is more about survival rather than a robust recovery.
- The RSI sits at 52.93, indicating a neutral market condition.
- Bollinger Bands indicate price proximity to the mid-band at $43.38, suggesting potential volatility.
- Average Daily True Range (ATR) indicates normal price fluctuations around 3.3%.
Intraday Momentum: A Glimmer of Hope?
This divergence between daily and intraday signals is crucial for investors to note. A short-term bullish perspective may be enticing, yet without a stronger daily closure above the critical resistance levels, the overall bearish trend remains intact. As seen in previous analyses, such fluctuations invite scrutiny from investors concerned about market stability and potential reversals in trading sentiment.