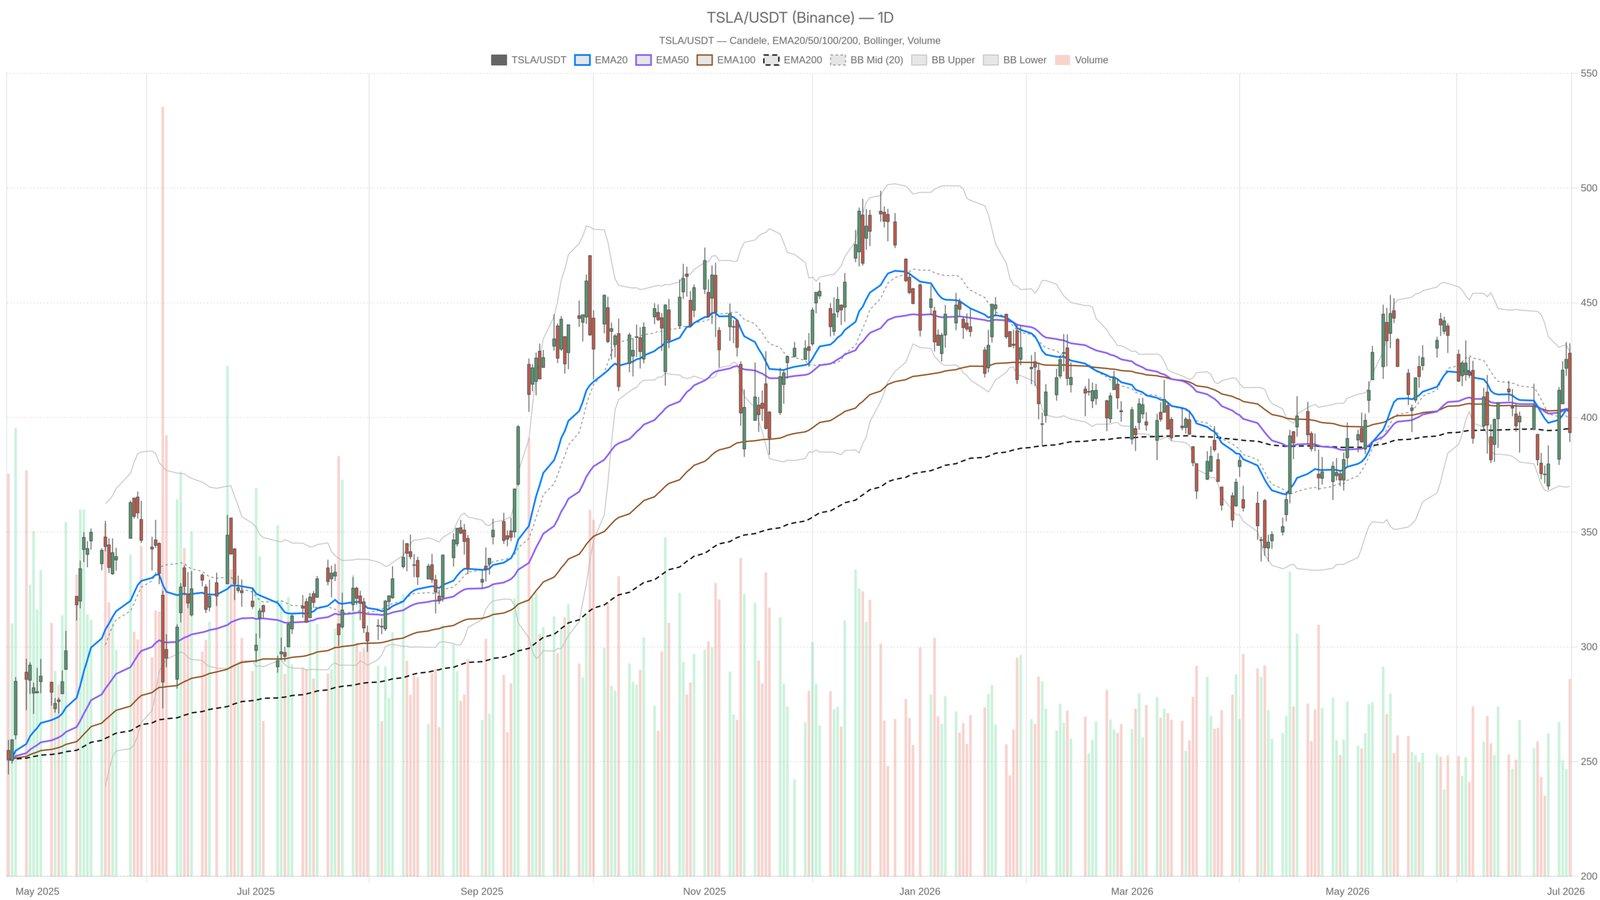
The recent decline of Tesla's stock (TSLA), which fell by around 9% from a high of $432.35 to close at $393.45 on July 2, 2026, raises critical questions about the direction of its market momentum. As it battles bearish pressure, the implications extend beyond immediate stock performance; they touch on broader market sentiments and investor strategies.
Current Technical Indicators and Market Sentiment
At the heart of this bearish sentiment is Tesla's precarious position around the crucial EMA200 level, currently at $395.03. Closing just above this average indicates a tenuous grip on support that has historically been significant. If the stock descends below this level, it may trigger wider sell-offs, targeting the S1 pivot at $377.72. The technical landscape suggests that the short-term trend is unfavorable, as TSLA has positioned itself below the EMA20 and EMA50, signaling a bearish structure with resistance densely clustered around $403.
Volatility and Price Movement Dynamics
The volatile nature of Tesla's stock, illustrated by a daily Average True Range (ATR) of 19 points, suggests that traders may face substantial intraday price swings. This heightened volatility can create opportunities, yet it also requires caution as it signals an uncertain market environment. A close below $395 could exacerbate concerns, casting shadows on the buying pressure that the bulls need to regain control.
Momentum Indicators and Potential Scenarios
Looking at momentum indicators such as the RSI and MACD provides further insights into the stock’s trajectory. The RSI at 46.77 indicates it is nearing the lower end of its range, lacking any signs of oversold conditions yet also failing to recover significant upward momentum. This situation suggests no immediate capitulation signals but an ongoing struggle for bullish momentum. Similarly, the MACD indicates that selling pressure may be moderating, with the main line at -1.63 and the signal line at -3.29.
- Key levels to watch:
- EMA200 at $395.03 critical support level
- Resistance at the EMA20 ($402.42) and EMA50 ($403.29)
- Potential target for bears if $395 is breached: S1 support at $377.72
In conclusion, Tesla's stock finds itself at a pivotal point. Whether it can hold above $395 will determine if the bulls have enough strength to reclaim certain bullish signals or if the bears will continue to dominate this high-volatility environment. Investors should closely monitor these dynamics, as they will have significant ramifications not only for TSLA but also for broader market trends.