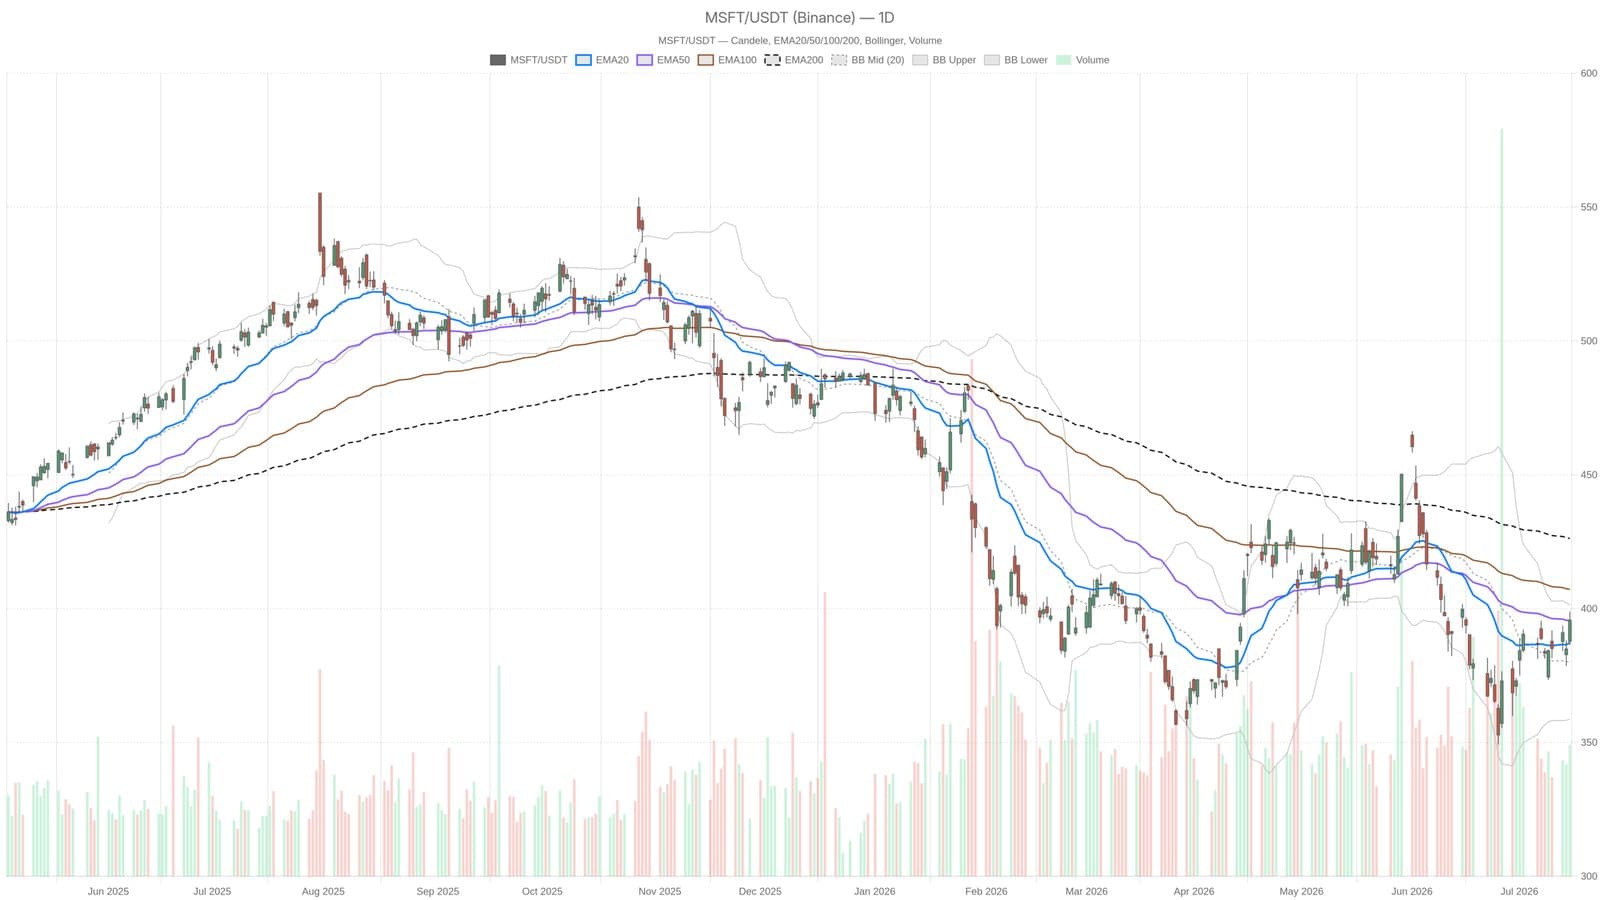
Microsoft Corporation's stock has found itself at a key juncture, currently priced at $395.63. This position is just a whisker below the critical daily EMA50 at $395.64, suggesting that while there is some short-term bullish momentum, the broader trend remains unconfirmed with a significant resistance overhead at the EMA200, resting at $426.22.
The upcoming earnings report on July 29 will act as a potential turning point. Investors are holding their breath, as the results could either solidify confidence in the stock or reveal underlying weaknesses that have yet to be addressed. With the company actively investing in artificial intelligence a sector that has captivated the market the stakes are particularly high.
Technical Indicators Show Caution and Potential
The daily chart reveals a mixed but cautiously optimistic picture. While the stock has recently been trading within a broad range of $386.40 to $398.96, the closing price at $395.63 signifies a slight improvement in momentum. However, the lingering presence of the EMA200 creates an environment of uncertainty, indicating that further gains are not assured.
The MACD (Moving Average Convergence Divergence) is another tool highlighting this cautious sentiment. Although it sits in negative territory at -2.96, the histogram’s reading of +2.99 indicates a deceleration in selling pressure. This could point to an early recovery sign, but it should not be mistaken for a full-blown bullish trend. The daily RSI (Relative Strength Index) at 53.5 adds another layer of neutrality, showing no immediate overbought conditions while leaving the door open for further upside potential.
Market analysts from Citi and Mizuho have adjusted their price targets for MSFT, reflecting a careful balancing act between concerns regarding capital expenditures and strong conviction in AI's long-term value. This sentiment aligns with the broader market trends where many tech stocks are currently facing a similar crossroads.
As this earnings report approaches, traders will be watching closely for any signs of a breakout or a pullback, particularly given the pressing $388 $401 range that defines the immediate battleground. The volatility indicated by a daily ATR (Average True Range) of $12.49 suggests that significant price movement is likely, adding to the urgency surrounding the upcoming earnings.
This content is for informational purposes only and should not be considered financial advice.