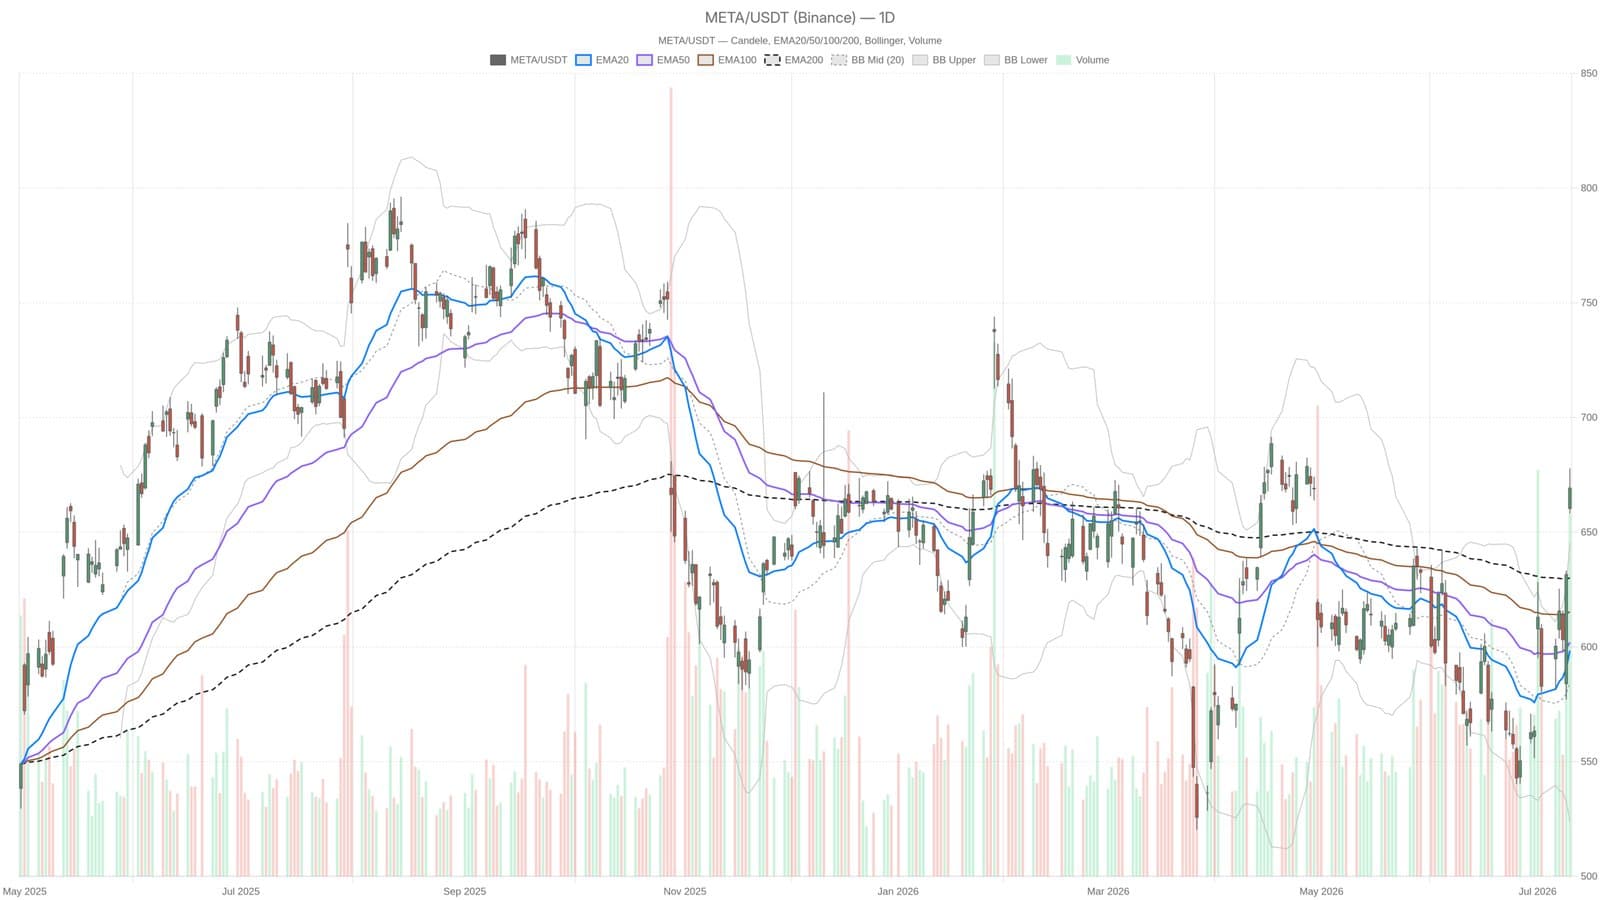
As of July 10, 2026, Meta's stock price has surged to an impressive $669.21, significantly surpassing its key exponential moving averages (EMAs). This bullish momentum raises critical questions for investors: Is the stock overvalued, or is there substantial growth potential ahead?
Current Technical Analysis
The stock has successfully broken above the EMA20 at $598.34, EMA50 at $602.00, and EMA200 at $630.03, indicating a strong bullish trend in place. The momentum indicators further substantiate this optimistic sentiment. The MACD stands firmly in positive territory, showcasing a histogram of 11.18, while the Relative Strength Index (RSI) is nearing overbought territory at 66.34, suggesting that the market may soon face a consolidation phase. The hourly RSI is even higher at 72.14, indicating short-term overbought conditions that contradict the otherwise bullish setup.
Market Implications and Future Predictions
The pending production of Meta’s in-house AI chip, scheduled for September, acts as a key catalyst for future growth. This strategic move into AI technology could significantly impact revenue streams and market positioning, especially as competition intensifies across technology sectors. However, traders should be cautious as the price trades above the upper Bollinger Band, positioning it as a volatile asset. Closing above this upper band can signal overheating, creating potential mean-reversion pressure towards the mid-band at $584.61.
As the stock flirts with its daily pivot of $668.36, close monitoring of resistance levels, particularly R1 at $678.71, and support at S1 $658.86 is essential. The current market sentiment seems to reflect an entrenched bullish bias, but the 'neutral' reading on the daily regime indicator suggests caution may be warranted as investor positioning extends significantly.
This article is for informational purposes only and should not be considered financial advice.