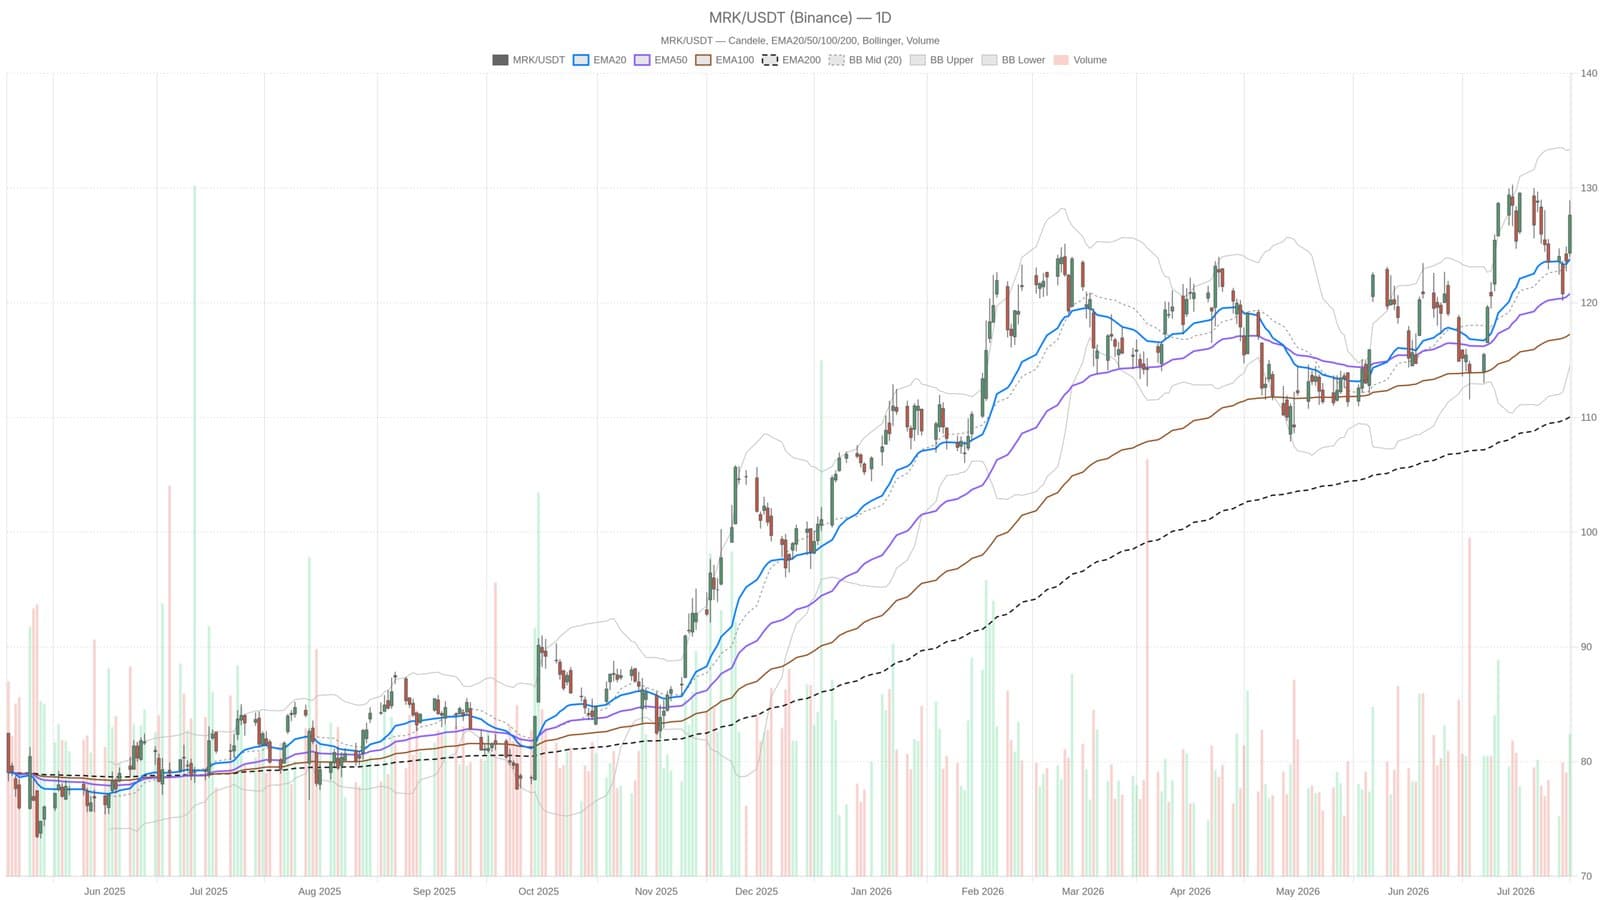
On July 16, Merck's stock experienced a significant surge, closing at $127.63 after the FDA granted approval for its oral PCSK9 inhibitor, Lipfendra, aimed at treating hypercholesterolemia. This jump from $124.33 reflects not only a positive regulatory response but also an overall bullish market sentiment surrounding the stock.
Technical Indicators Support a Bullish Outlook
The daily chart for Merck shows a solid bullish structure, with the price comfortably above the key exponential moving averages (EMAs). The EMA20 sits at $123.78, EMA50 at $120.78, and EMA200 at $110.05. This stacking of EMAs confirms a sustained upward trend rather than a fleeting spike. Notably, the gap between the current price and the EMA200 exceeds $17, indicating that the stock's longer-term mean is not currently a threat.
Analyst Sentiment and Market Implications
Analysts have responded positively, with price targets ranging from $138 to $155, significantly above the fair value estimate of $132.78. Guggenheim has reiterated a Buy rating, reflecting confidence in Merck's growth prospects. However, the hourly Relative Strength Index (RSI) is at 70.11, suggesting that the stock may be overbought in the short term, which could lead to a pullback or consolidation phase.
- The daily RSI indicates a level of 58.13, suggesting constructive momentum without immediate overbought risk.
- MACD analysis shows some deceleration in momentum, which is typical within an uptrend.
- Bollinger Bands indicate that the stock is trading in the upper half of the channel, with the upper band at $133.35 providing a target for potential resistance.
This key moment for Merck highlights the importance of regulatory approval in shaping investor sentiment and market performance. As the stock navigates between bullish momentum and potential overbought conditions, investors should remain cautious yet optimistic about its trajectory.
This material is informational and not financial advice.