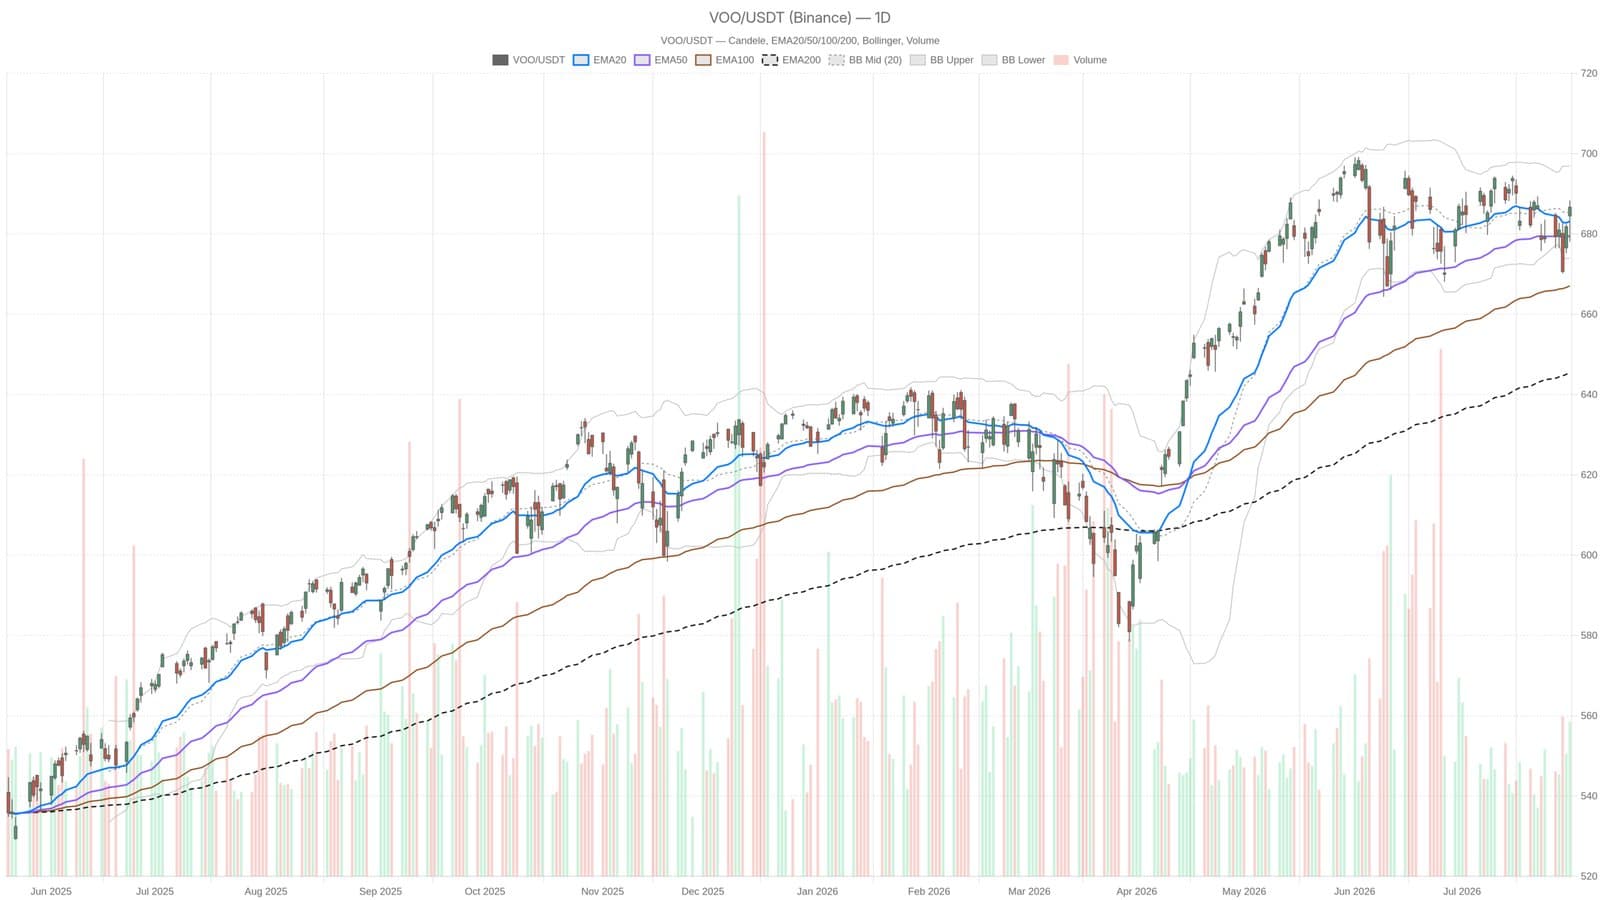
On July 31, Vanguard's S&P 500 ETF (VOO) settled at 686.65 after moving between 678.06 and 688.35 during the session, reflecting some volatility amid a steady uptrend.
The daily chart reveals VOO comfortably above key moving averages with EMA20 at 683.14, EMA50 at 679.50, and EMA200 at 645.45. These levels indicate a strong bullish foundation that has held firm over time.
Despite this, momentum indicators suggest caution. The daily RSI stands at 52.92, indicating neutral momentum far from overbought conditions. Meanwhile, the MACD histogram shows a negative reading, signaling that price gains are outpacing underlying momentum.
Volatility remains moderate with the ATR14 at 7.70, and Bollinger Bands frame the current consolidation with an upper band near 697 and a lower band around 674. The ETF is positioned just above the midline, hinting at potential room to move higher but also reflecting sideways price action.
The critical resistance zone around 687 to 690 has proven difficult to break, suggesting the market is digesting recent advances rather than pushing aggressively higher. This setup mirrors cautious investor sentiment despite the overall bullish trend.
This content is for informational purposes only and is not financial advice.