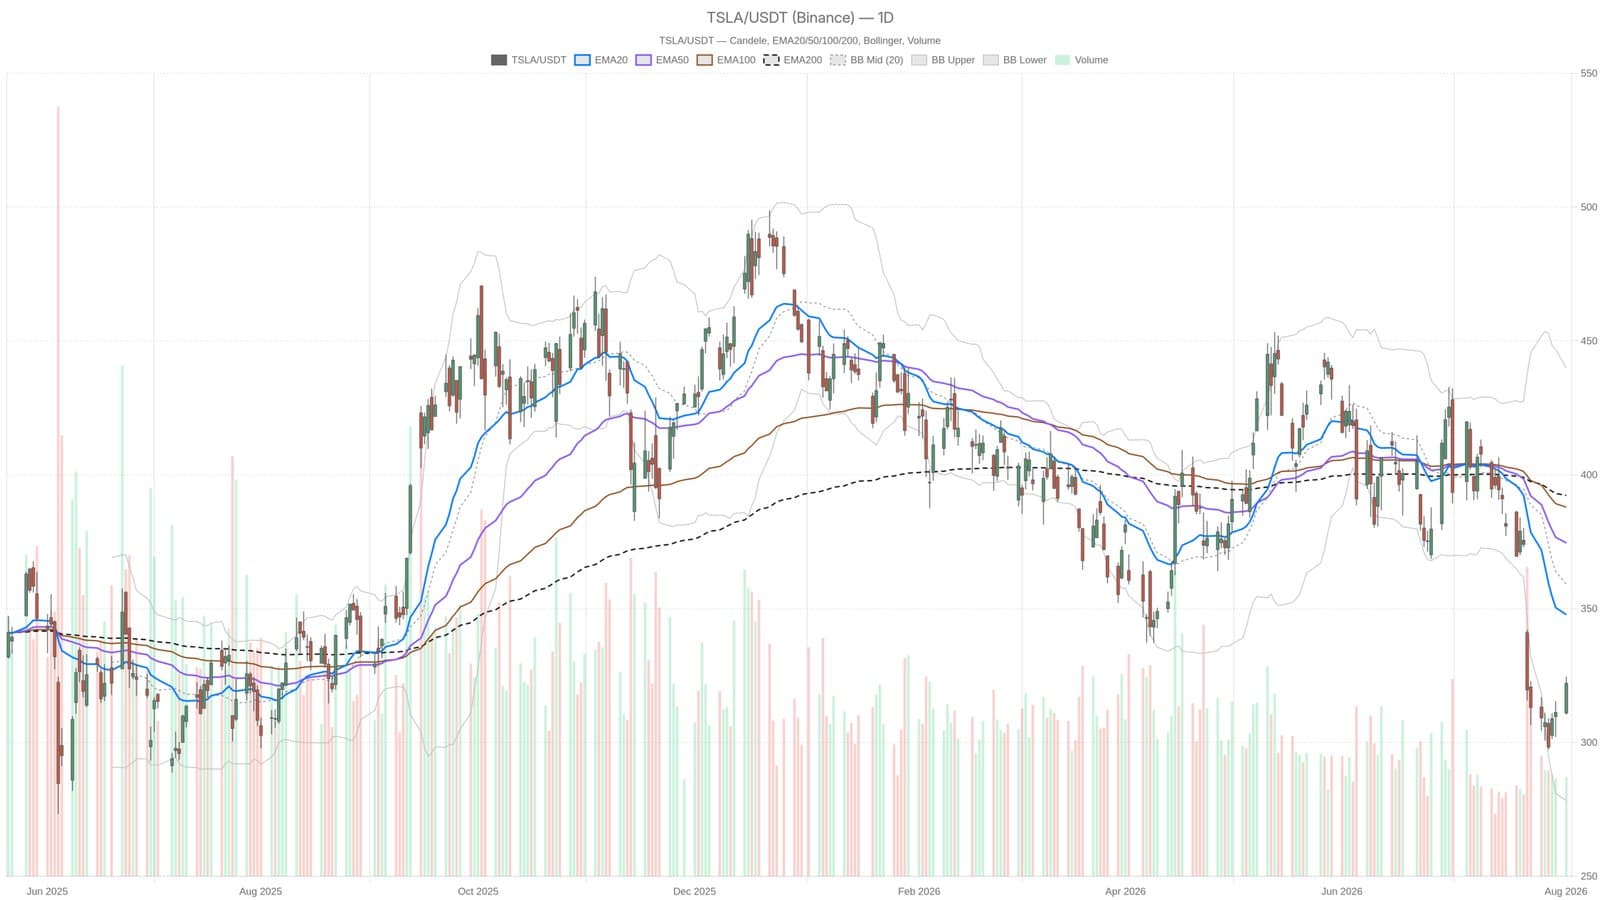
Tesla shares clawed back some ground this week, but the rebound masks a stubborn problem: the stock sits stubbornly below every major moving average, and one of the Street's most vocal bulls just pumped the brakes. At $322.08, TSLA trades beneath the 20-day EMA at $347.72, the 50-day at $374.55, and the 200-day at $392.32. That stacking of resistances above price tells the whole story. The bounce is real. The downtrend is realer.
Tesla registrations in Italy tanked 77 percent in July alone. That's not a regional hiccup. It signals demand is cracking faster than the company's messaging can spin it. Meanwhile, daily momentum indicators paint a divided picture. The RSI sits at 36.83, soft but not yet screaming capitulation. The MACD is negative at -24.71, still below its signal line. Price action has tightened the histogram from -4.74, but the direction hasn't flipped. Bollinger Bands show the mid-line at $359.05, with Tesla trading well below it. Volatility, measured by the 14-day ATR, is elevated at 16.33, meaning swings of that size in either direction remain entirely plausible.
The Hourly Chart Says One Thing, the Daily Says Another
Here's where it gets weird. On the one-hour timeframe, momentum has turned genuinely bullish. The hourly RSI prints 64.41, well into overbought territory, and price has been grinding higher throughout the session. But step back to the daily chart and you're looking at a bear market structure. The bounce hasn't erased the damage. Traders holding positions are caught between two conflicting signals: hourly strength that feels real but sits atop a daily foundation that's still crumbling. Pivot levels show the stock currently trades above the daily pivot at $319.05 but remains capped below resistance at $327.68. Bulls have reclaimed near-term ground without breaking into clearly bullish setup.
Why the Cautious Turn Matters
A top-tier Wall Street analyst, historically one of Tesla's most steadfast defenders, has downgraded expectations this week. The shift doesn't signal capitulation across the board, but it does suggest conviction is fragmenting. When your biggest bull starts hedging, it matters. The post-earnings rally that sparked short-term enthusiasm has run into resistance faster than most expected. The daily chart structure remains intact and bearish. That $359 mid-band on the Bollinger Bands is now the line in sand. Break above it convincingly and the narrative shifts. Stay below it and the bounce becomes another head fake in a larger downtrend.
This is informational analysis only, not financial advice. Trading carries significant risk and positions should reflect your own risk tolerance and research.