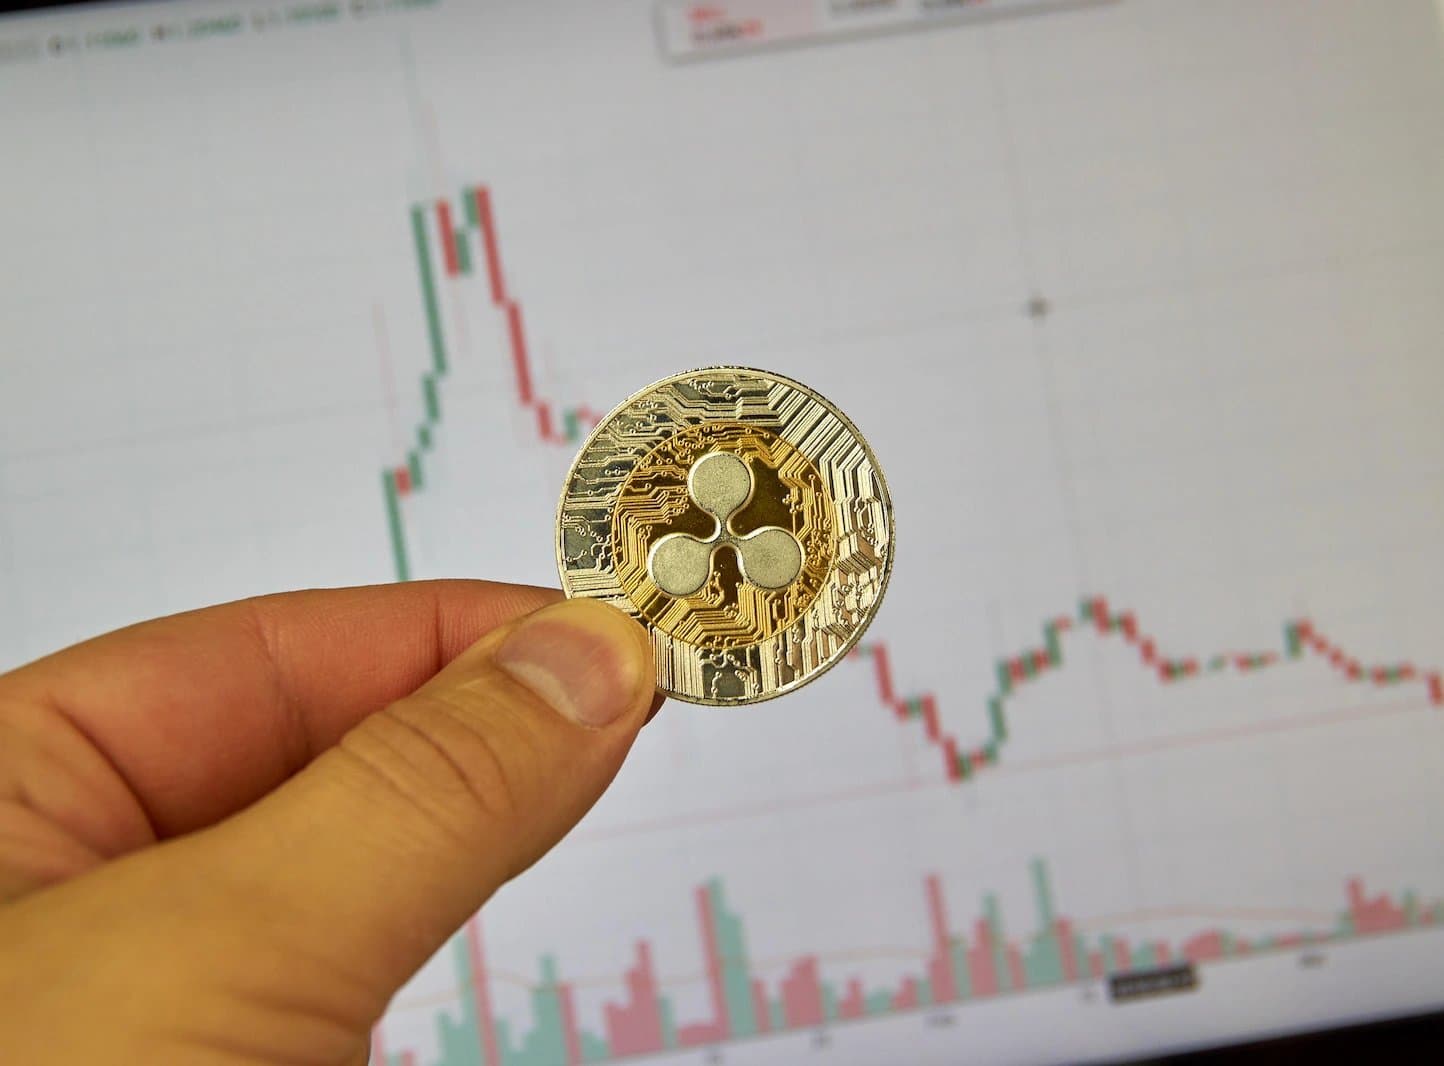
Solana dropped to $72.55 on August 3, bleeding 1.47% as traders who bought the dip failed to stick around. The token is now testing support near $71.50, with the risk of a slide all the way to $70 if momentum doesn't reverse. What makes this move worse is that nobody seems to be catching it. Spot buying dried up completely.
The Chaikin Money Flow indicator hit -0.17, meaning more money is leaving Solana than entering it. That's the kind of reading that happens when a bounce lacks conviction. Price bounced off the lower Bollinger Band at $71.49 on August 2, but when it tried to climb back, volume from real buyers never showed up. Without spot demand, any rebound becomes fragile because it's held together by leveraged trades instead. Those positions blow up first when selling accelerates.
Solana has been sliding since July, when it peaked near $82.50. Sellers have been patient, defending each bounce. First they held at $78, then at $76. Now the daily Bollinger midpoint at $75.09 has flipped from support to resistance. The Awesome Oscillator sits at -3.56 with red bars expanding below zero, which points to momentum getting worse, not better.
If the $71.50 level cracks, liquidation clusters between $73.50 and $74.50 become the only meaningful upside target before bulls can claim anything. That zone used to be price support. The chart pattern itself is deteriorating, a sequence of lower highs and lower lows that traders read as a trend in control.
This analysis is for informational purposes only and does not constitute investment advice or a recommendation to buy or sell any asset.