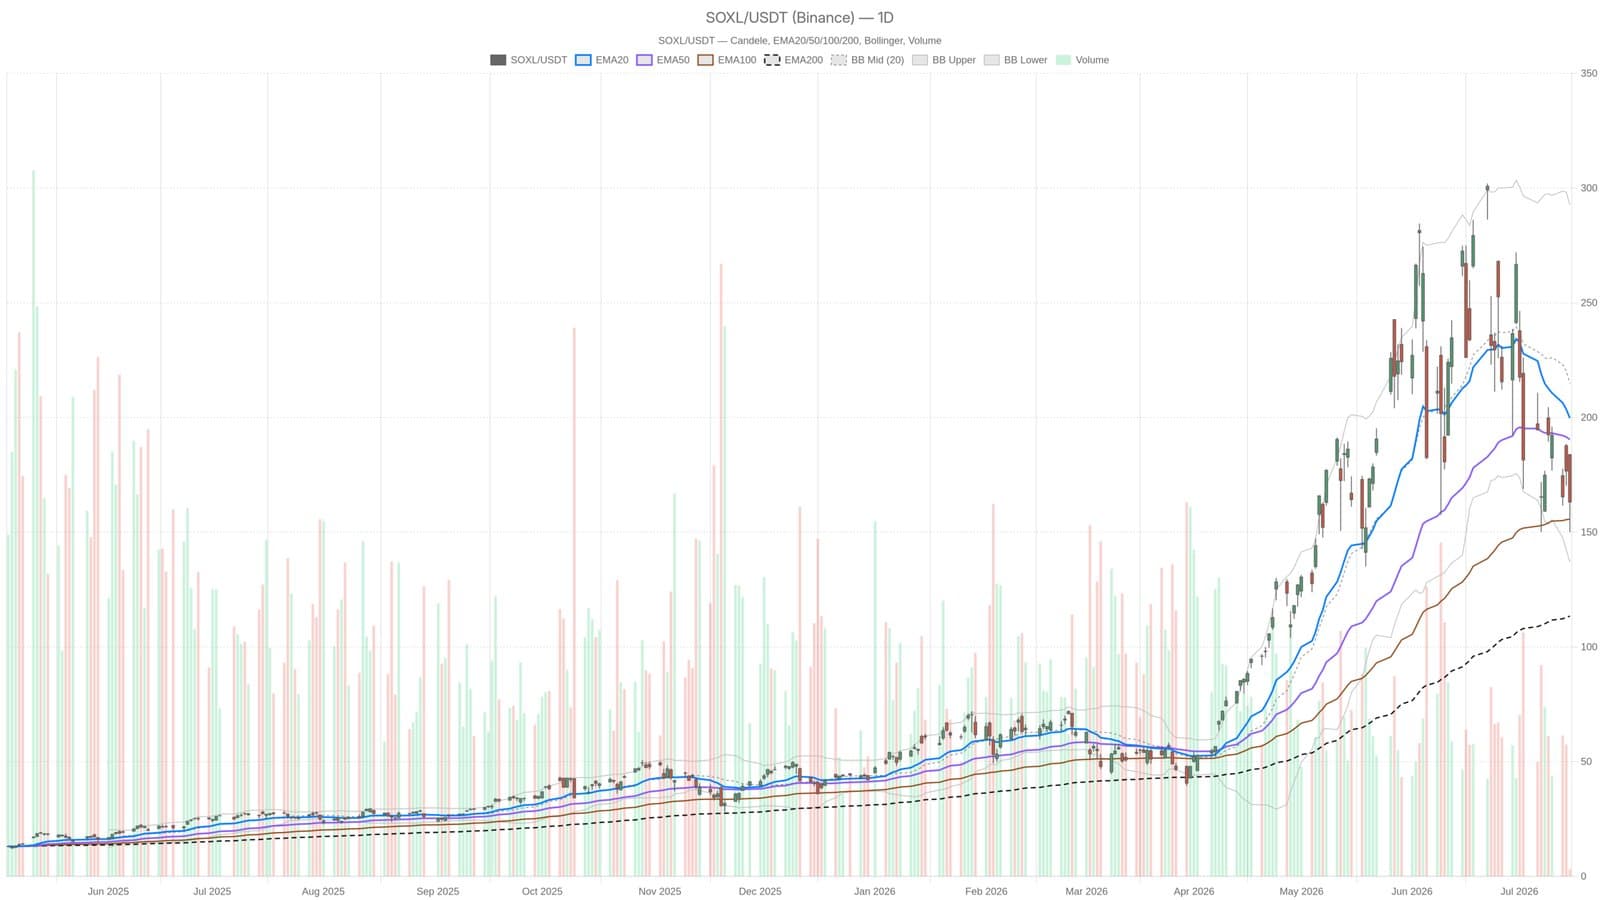
Direxion Daily Semiconductor Bull (SOXL) stock has experienced a substantial decline, plummeting from an opening price of $183.82 to a session low of $150.00, ultimately closing at $163.12. This dramatic drop represents a 30% loss and signifies a critical juncture for the stock, prompting investors to reassess their positions.
Technical Indicators Suggest Bearish Momentum
The daily chart reveals significant technical damage, as SOXL is now well below both its 20-day EMA at $199.71 and 50-day EMA at $190.38. This positioning indicates a deterioration in market sentiment and trend. The daily Relative Strength Index (RSI) currently sits at 43.26, leaving room for further downside potential before any oversold conditions arise.
Adding to the bearish outlook, the MACD histogram registers at -7.98, showing an acceleration in bearish momentum. This divergence from its signal line further suggests that the downward pressure is intensifying rather than stabilizing. Investors should also consider the implications of Bollinger Bands, which indicate that the midline at $214.81 is far from the current trading levels, with the lower band at $136.98 serving as a potential target if selling persists.
Despite a daily average true range (ATR) of $35.85 highlighting high volatility, immediate resistance is identified at $165.68, just above the closing price. The overall market sentiment remains bearish, with the daily regime classified as neutral but leaning heavily toward further declines.
Hourly Analysis Confirms Bearish Sentiment
The hourly chart reinforces the bearish narrative, showing SOXL trading below its entire EMA stack. The stock's close at $163.12 is situated beneath the EMA20, EMA50, and EMA200, all aligned in descending order above the current price. This pattern is a classic indicator of a prevailing downtrend.
The macroeconomic backdrop, coupled with these chart signals, raises concerns about whether holders will recover their investments or face additional losses in the coming months. Investors would be prudent to stay vigilant and consider these indicators before making any decisions.
This article is for informational purposes only and should not be considered financial advice.