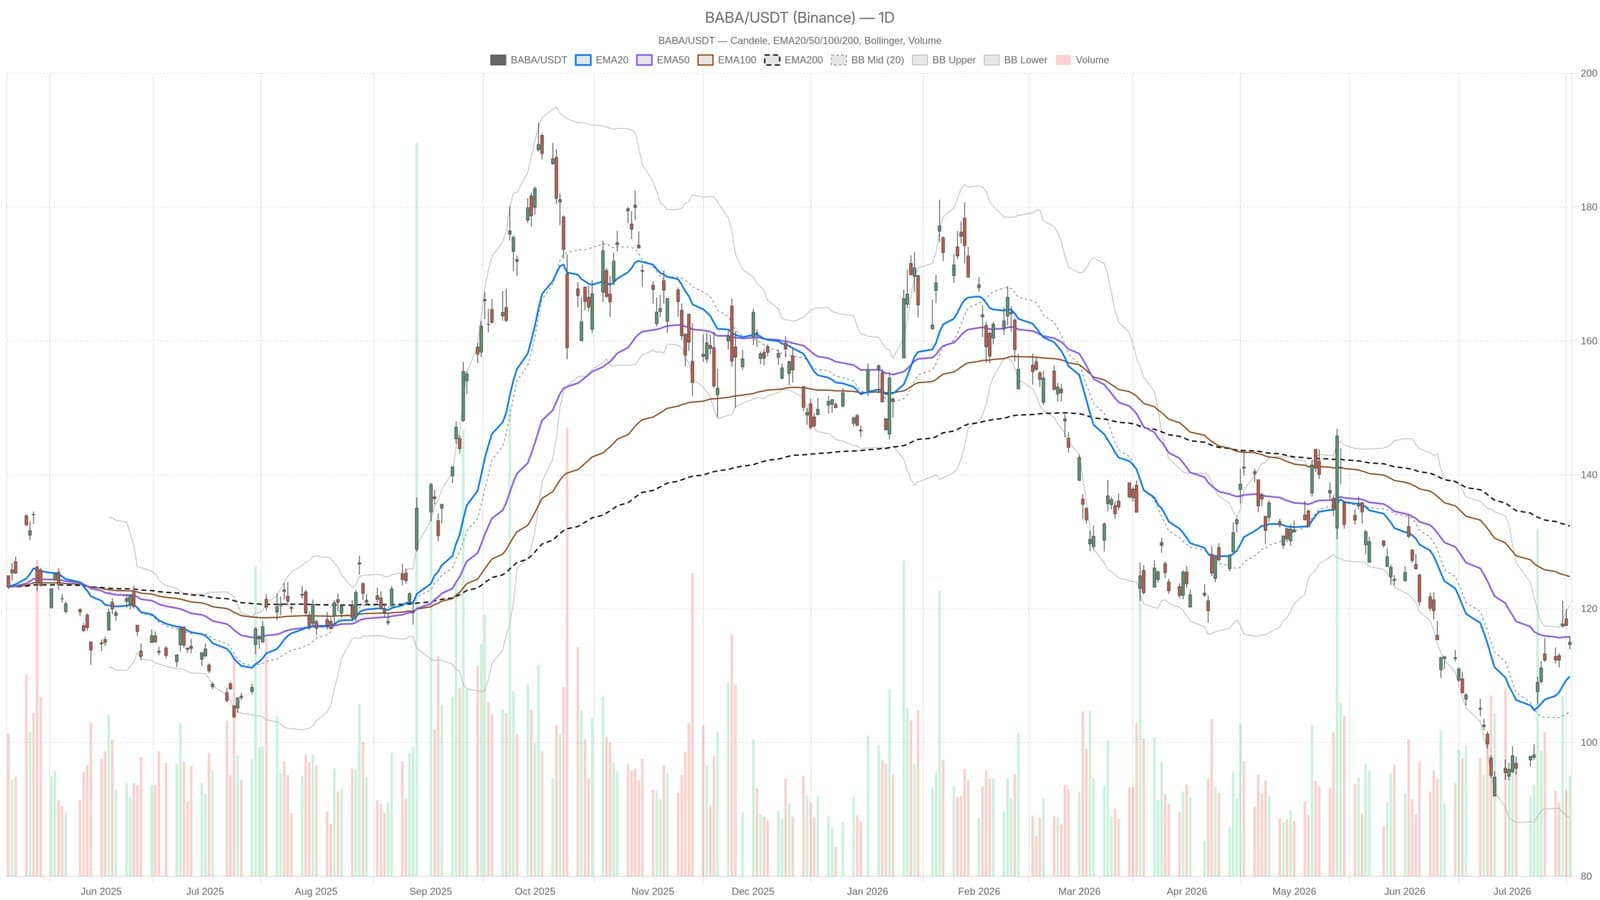
Alibaba’s stock surged 5.4% recently on the back of AI-driven optimism, closing at $114.97 on July 17. This price point places the shares precariously close to the 50-day exponential moving average (EMA) at $115.76, a historically decisive technical threshold. The stock’s behavior around this level is critical: breaking above could signify a shift toward recovery, while failure to do so risks renewed downward momentum.
Technical Indicators Signal Tentative Bullishness
The stock is currently trading well above its 20-day EMA of $109.86, confirming some near-term strength. Yet the 200-day EMA remains distant at $132.35, indicating that the long-term trend has not fully healed from prior weaknesses. Momentum metrics provide a mixed but slightly positive outlook. The daily Relative Strength Index (RSI) stands at 57.33, comfortably above the neutral 50 level but below overbought territory, implying potential for further gains without immediate exhaustion.
More revealing is the Moving Average Convergence Divergence (MACD) histogram, which jumped to +2.82 despite the MACD line itself remaining close to zero at -0.01. This divergence suggests accelerating bullish momentum beneath the surface, hinting that buyers may soon push the price decisively above the 50-day EMA.
Volatility and Price Range: A Double-Edged Sword
Alibaba’s Bollinger Bands position the current price solidly within the upper half of the band range, between the midpoint at $104.66 and the upper band at $120.57. This placement reflects a significant rally from recent lows but stops short of signaling an overextended market. The stock’s average true range (ATR) of $3.97 highlights considerable session-to-session price swings, underscoring the inherent volatility and risk investors face in the near term.
Fundamental Catalyst: The AI Opportunity
The recent AI narrative driving Alibaba’s stock stems mainly from regulatory approval by China’s Cyberspace Administration for the Qwen3.8 Max AI model to power Apple devices in China. This partnership not only taps into China’s massive consumer tech ecosystem but also positions Alibaba as a key player in AI infrastructure, potentially unlocking significant revenue streams. Such developments provide a substantive fundamental underpinning for the recent bullish momentum.
If Alibaba manages a daily close above the 50-day EMA, the stock could test the next resistance near $120.57. Conversely, failure to surpass this level might result in a retreat toward the 20-day EMA support around $109.86. Given the volatility and technical setup, traders and investors should watch the $115.76 level closely as a litmus test for the sustainability of Alibaba’s AI-fueled rally.
Material is for informational purposes only and does not constitute financial advice.