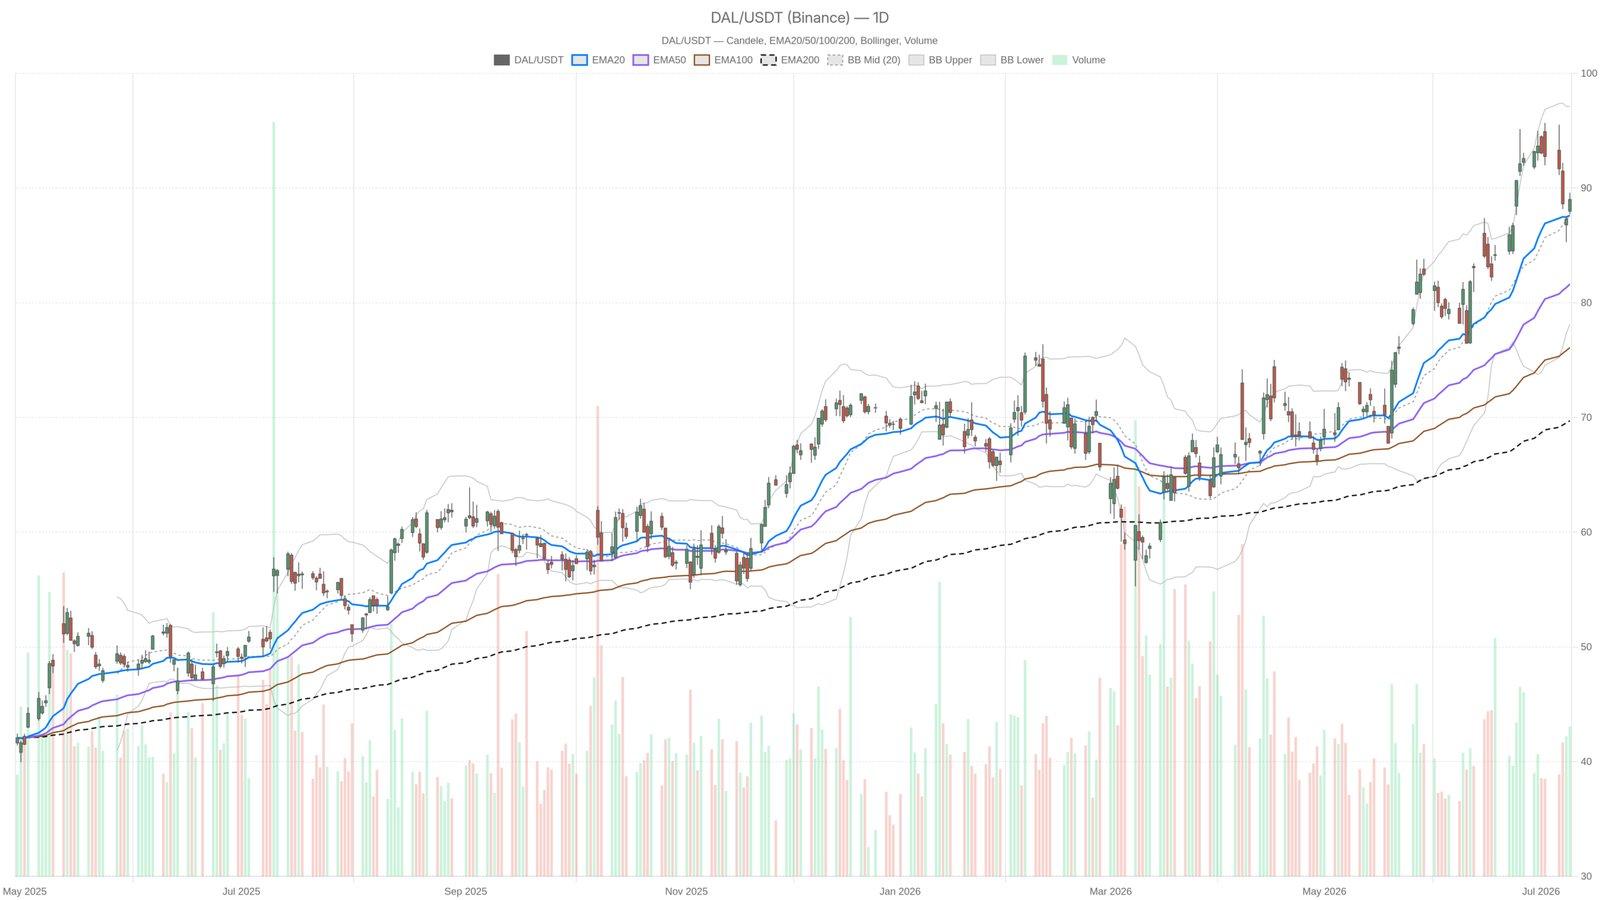
As Delta Air Lines approaches the release of its Q2 earnings on Friday, traders are bracing for potential volatility. With shares closing at $89.00 on July 9, just slightly above the daily pivot point, the stock is currently positioned within a broader bullish trend. However, the buildup to earnings often comes with a nuanced blend of optimism and caution, especially in the context of market reactions to earnings reports.
Understanding Current Market Conditions
Delta's stock remains well above its essential exponential moving averages (EMA) EMA20 at $87.62, EMA50 at $81.62, and EMA200 at $69.71. This alignment indicates a robust, sustained uptrend rather than a mere bounce. Still, with a daily Relative Strength Index (RSI) of 57.83, the stock does not yet appear overbought, leaving room for upward movement as traders gauge market sentiment ahead of the results.
Despite a strong bullish setup, the daily MACD suggests caution; while its positive value of 3.11 is encouraging, it has recently crossed below its signal line at 3.73, hinting at a potential softening in momentum. Such dynamics could set the stage for a volatile market reaction as investors react to the actual numbers.
Anticipating Potential Price Movements
The daily Bollinger Bands indicate a current trading range that reflects noticeable volatility. Prices are moving close to the midline, with an average true range (ATR) of $2.94 suggesting that a potential swing of $3 is not unusual. This established range implies that traders should prepare for movement that could challenge both bullish and bearish positions in the short term.
- Current pivotal price levels include:
- Pivot Point: $88.77
- Resistance (R1): $89.82
- Support (S1): $87.95
At $89.00, Delta's stock is teetering between the pivot and the first resistance level. A breakout above $89.82 could encourage further bullish activity, while slipping below $87.95 might trigger technical selling pressure. Investors should be wary as they navigate this critical phase.
Conflicting Signals on Hourly Charts
While the daily perspective offers a relatively bullish view, the hourly chart presents a mixed picture. Intraday trends often provide valuable insights into how sentiment shifts in response to external events such as earnings announcements. The contrasts between daily and hourly charts highlight the complexity and rapid changes occurring beneath the surface.
As Delta Air Lines prepares to unveil its Q2 results, the interplay between bullish trends and the potential for a strong price swing underscores the importance of careful monitoring. Traders and investors alike must consider the broader implications of these results, which could subsequently affect market dynamics moving forward.
The content provided herein is for informational purposes only and should not be construed as financial advice.