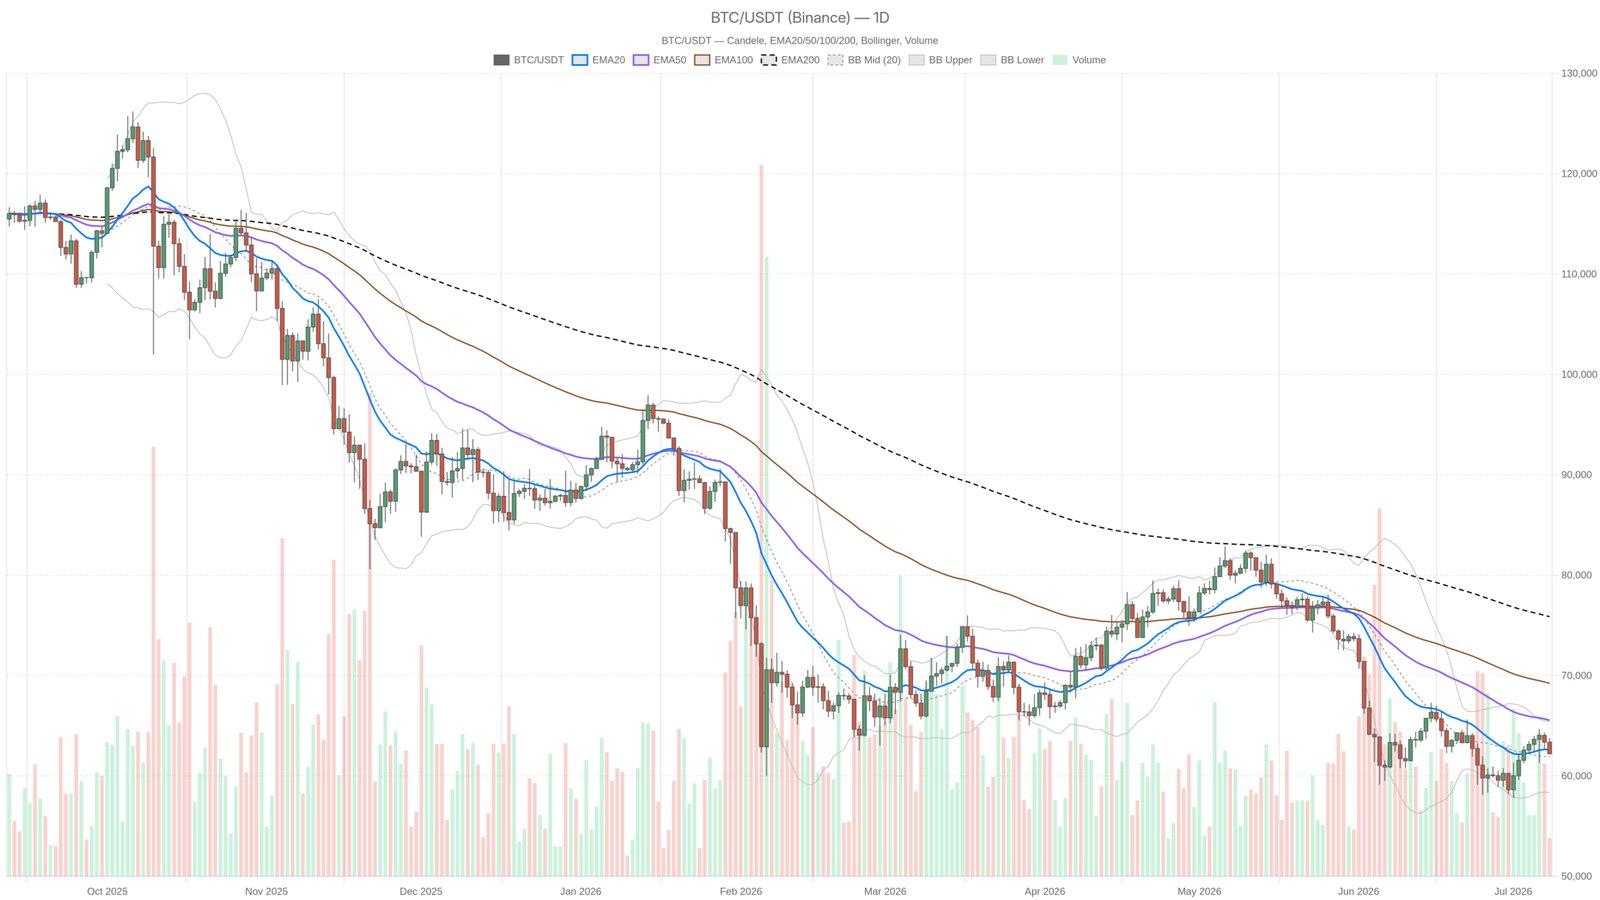
As of July 8, 2026, Bitcoin's price sits at $62,210, trapped beneath critical moving averages while the Fear & Greed Index indicates extreme unease across the market. This situation presents a complex environment for investors as the potential for downward movement looms large.
Why This Matters for Investors
Understanding current market sentiment is essential for making informed trading decisions. With the Fear & Greed Index at 20, we are deep in 'Extreme Fear' territory, suggesting that market participants are heavily pessimistic. This situation often serves as a warning sign; historical trends indicate that such sentiment is a precursor to further price corrections.
- Bitcoin Price: $62,210
- 20-day EMA: $62,602
- 50-day EMA: $65,552
- Daily RSI: 45.88
The technical analysis highlights that Bitcoin is not only trading below both the 20-day and 50-day EMAs, but also the key 200-day EMA currently sits far overhead at $75,870. This downward structure presents a clear bearish outlook for Bitcoin, indicating that support levels are fragile and susceptible to further declines. Bitcoin's dominance at 55.98% reinforces that it is the primary driver of the market downturn, leaving altcoin investments vulnerable.
Market Dynamics and Technical Indicators
Despite the seemingly neutral hourly regime, the undercurrents reveal a more troubling scenario. Although the daily RSI has not breached the oversold territory, maintaining a reading of 45.88 leaves room for additional declines. Typically, in a robust downward trajectory, the RSI stabilizes between 35-50 without triggering a significant recovery. Additionally, the Bollinger Bands are positioned closely around the current price, with the midline at $61,897 acting as resistance rather than support in this bearish environment. The potential for substantial price swings remains high, as indicated by an Average True Range (ATR) of $2,155.
What's Next for Bitcoin Traders?
As investors navigate this uncertain landscape, all eyes should be on critical support levels, particularly the 1H 200-EMA at $62,213, as well as the lower band of the Bollinger Bands at $58,380. The upcoming trading sessions could yield significant volatility, which may force traders to reassess their strategies. Furthermore, ongoing developments in the regulatory landscape, such as those discussed in recent articles, will also influence future price movements.
This material is for informational purposes only and does not constitute financial advice.