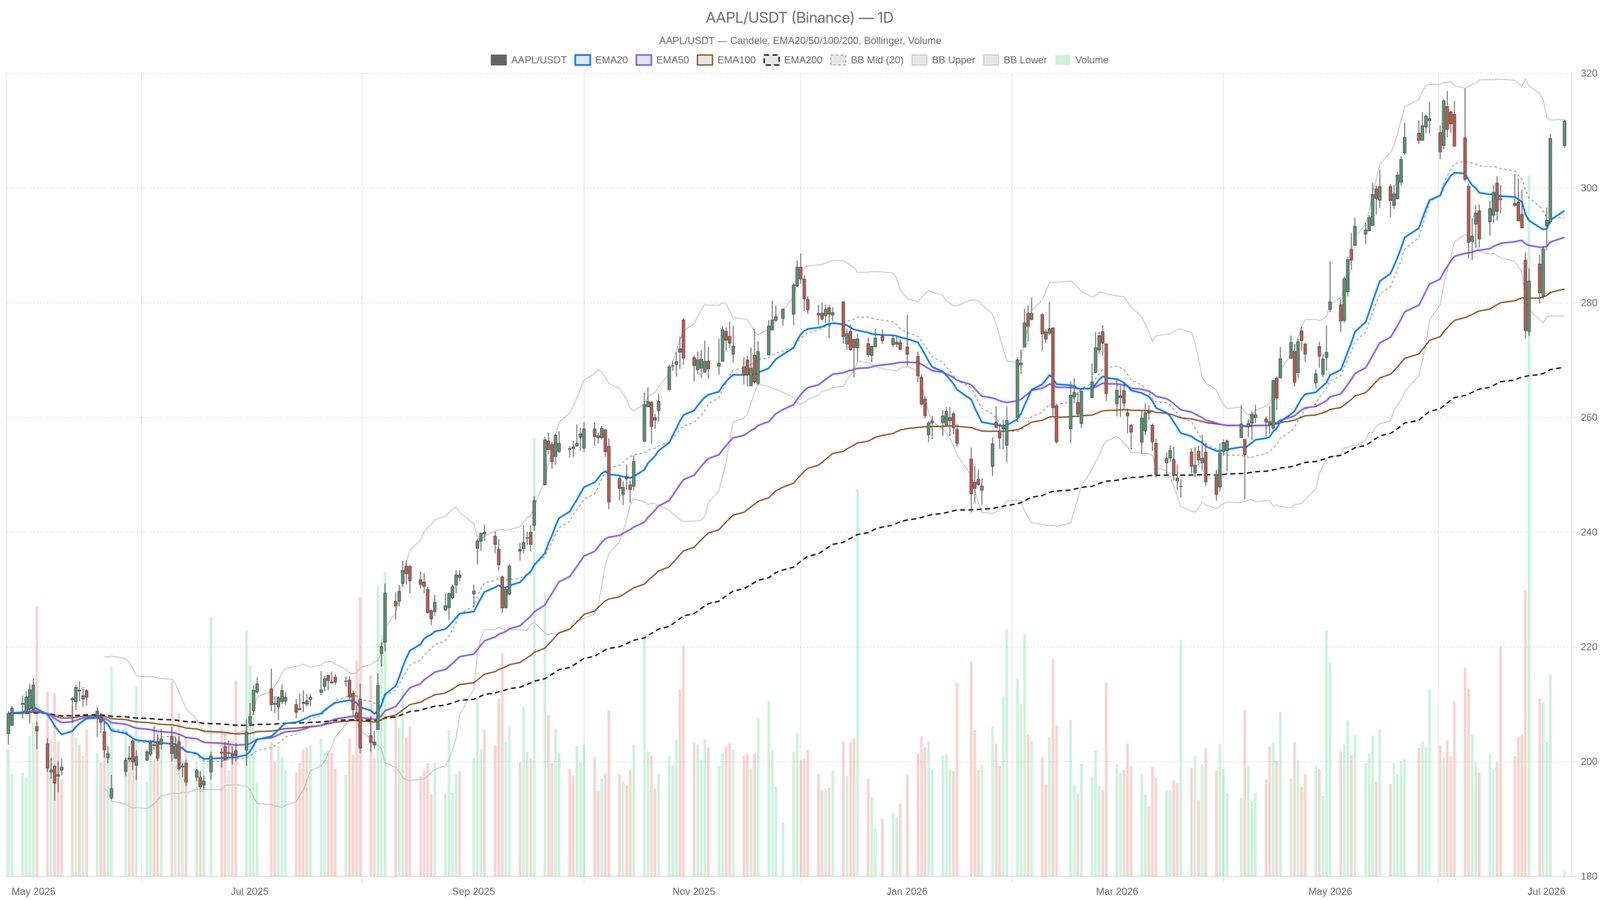
In the current investment landscape, Apple Inc. (AAPL) shares are showcasing a compelling upward trajectory, recently closing at $311.70. This level is crucial as it positions the stock just beneath the upper boundary of the daily Bollinger Bands, which lies at $311.99. The bullish momentum is underlined by a daily RSI of 61.94, indicating that while the asset has room to run, caution is warranted due to short-term overbought signals.
Understanding AAPL's Bullish Structure
AAPL’s daily chart displays a robust bullish structure, with the price consistently trading above key moving averages. The exponential moving average (EMA) stack illustrates a textbook bullish formation, with the 20-day EMA at $296.07, the 50-day at $291.42, and the 200-day EMA at $268.78. Such an arrangement not only shows sustained momentum, but it also reflects investors' confidence in AAPL's long-term growth potential.
Technical Indicators: A Mixed Picture
The dual indicators of the MACD and RSI reveal a nuanced picture. The daily MACD has crossed above its signal line, indicating a meaningful shift in momentum towards bullish sentiment. The histogram reading of 1.4 supports this view, suggesting that momentum is building rather than exhausting. However, the hourly RSI, surging to 81.57, highlights a concerning overbought condition. Such readings typically signal that a pullback or consolidation is likely, reflecting a short-term warning while the longer-term outlook remains positive.
Potential Strategies for Investors
Given the current dynamics, traders should adopt a measured approach. The pivot support level at $308.54 is critical; failure to hold above this price could jeopardize the bullish structure. Investors keen on entering the market may consider waiting for a pullback to validate support before initiating fresh positions. The statistical significance of being near the upper Bollinger Band reduces the margin for error, suggesting that while AAPL may continue to climb, the risk of a correction is also elevated.
With AAPL experiencing impressive momentum, parallels can be drawn to trends observed in tech stocks and broader market analyses, such as Micron's recent performance, which reflects similar investor confidence. Understanding these market signals is crucial for making informed trading decisions.