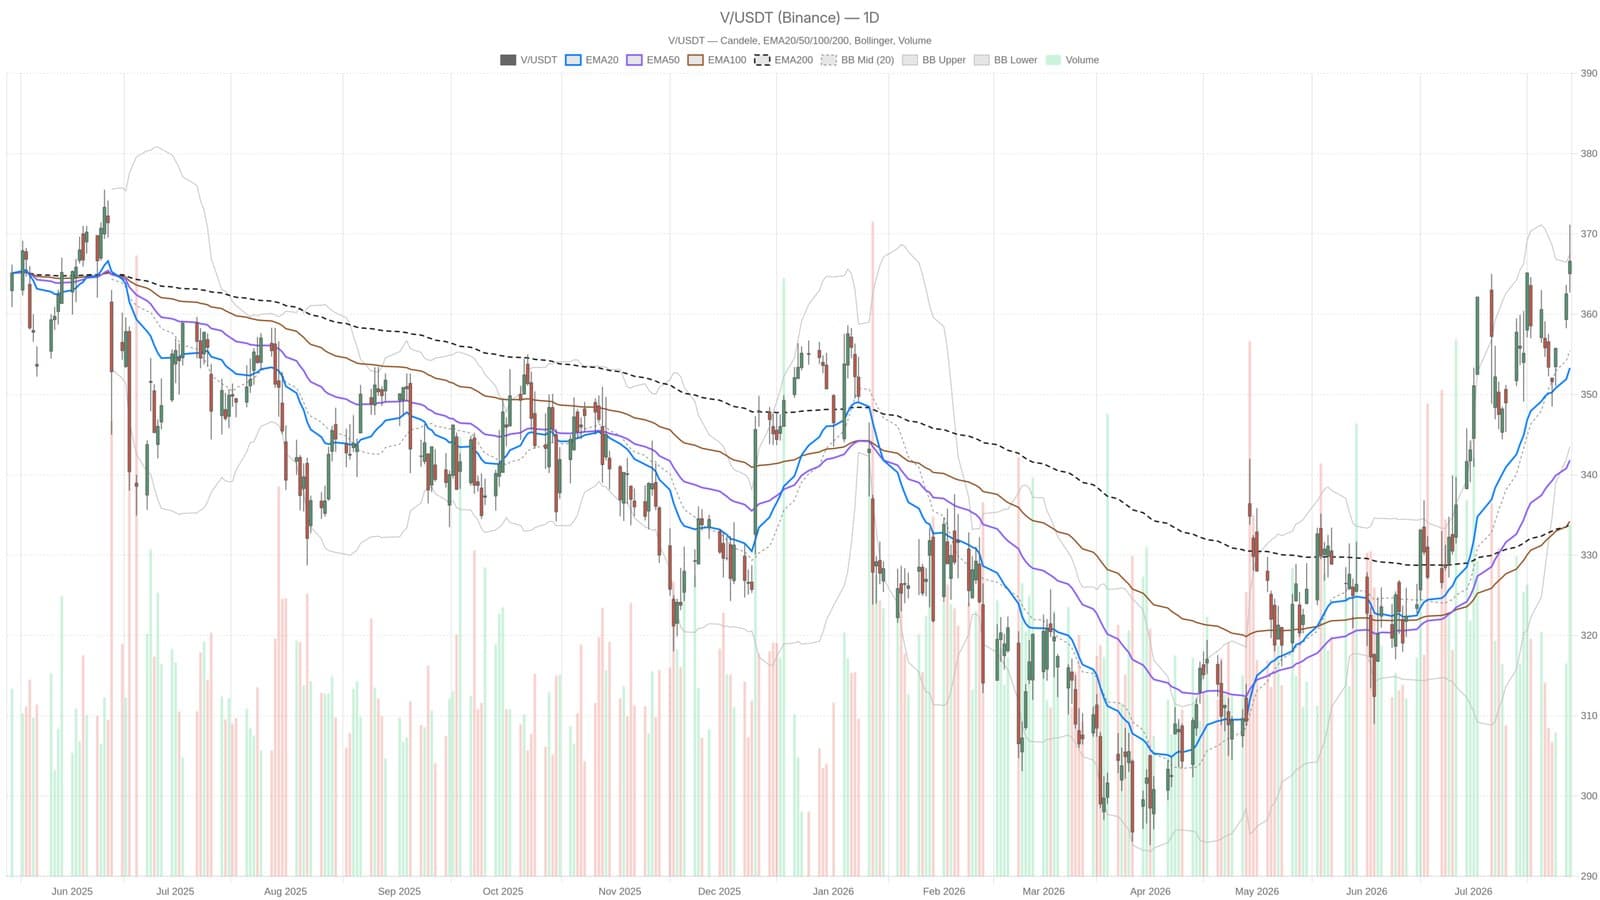
Visa's stock is struggling to push past the $367 mark even after reporting impressive earnings for Q3 2026. The company announced revenue of $11.6 billion, a 14% increase year-over-year, with earnings per share rising 11% to $3.32. Payment volumes topped $4 trillion, underscoring ongoing demand. Despite this, technical indicators suggest the rally might be losing steam.
Strong Earnings Meet Technical Resistance
On July 28, Visa shares closed just shy of $367, brushing against the upper Bollinger Band at $367.44. This level has acted as a significant resistance point. The stock remains in a bullish trend supported by the position above key exponential moving averages the EMA20 at $353.31, EMA50 at $341.81, and EMA200 at $333.84 all of which are aligned upward. The relative strength index (RSI) stands at 65.16, indicating solid momentum without clear signs of overbought conditions yet.
However, the daily MACD shows a slight negative histogram at -0.19, hinting that momentum may be plateauing. The proximity to the pivot point at $366.83 suggests the stock is indecisive. Breaking above the resistance level of $371 could trigger a move to $373, but failure to maintain support at $362.49 risks a sharper correction.
Short-Term Signals Point to Fatigue
On a shorter timeframe, the 15-minute chart reflects early signs of fatigue, with the price dipping below the 20-period EMA. This contrasts somewhat with the broader hourly trend, which remains supportive but cautious. The daily Bollinger Bands framing the price near the upper limit often precede a mean reversion toward the middle band around $355.47. Investors should watch these levels closely for evidence of whether the bullish trend can continue or if consolidation will dominate in the near term.