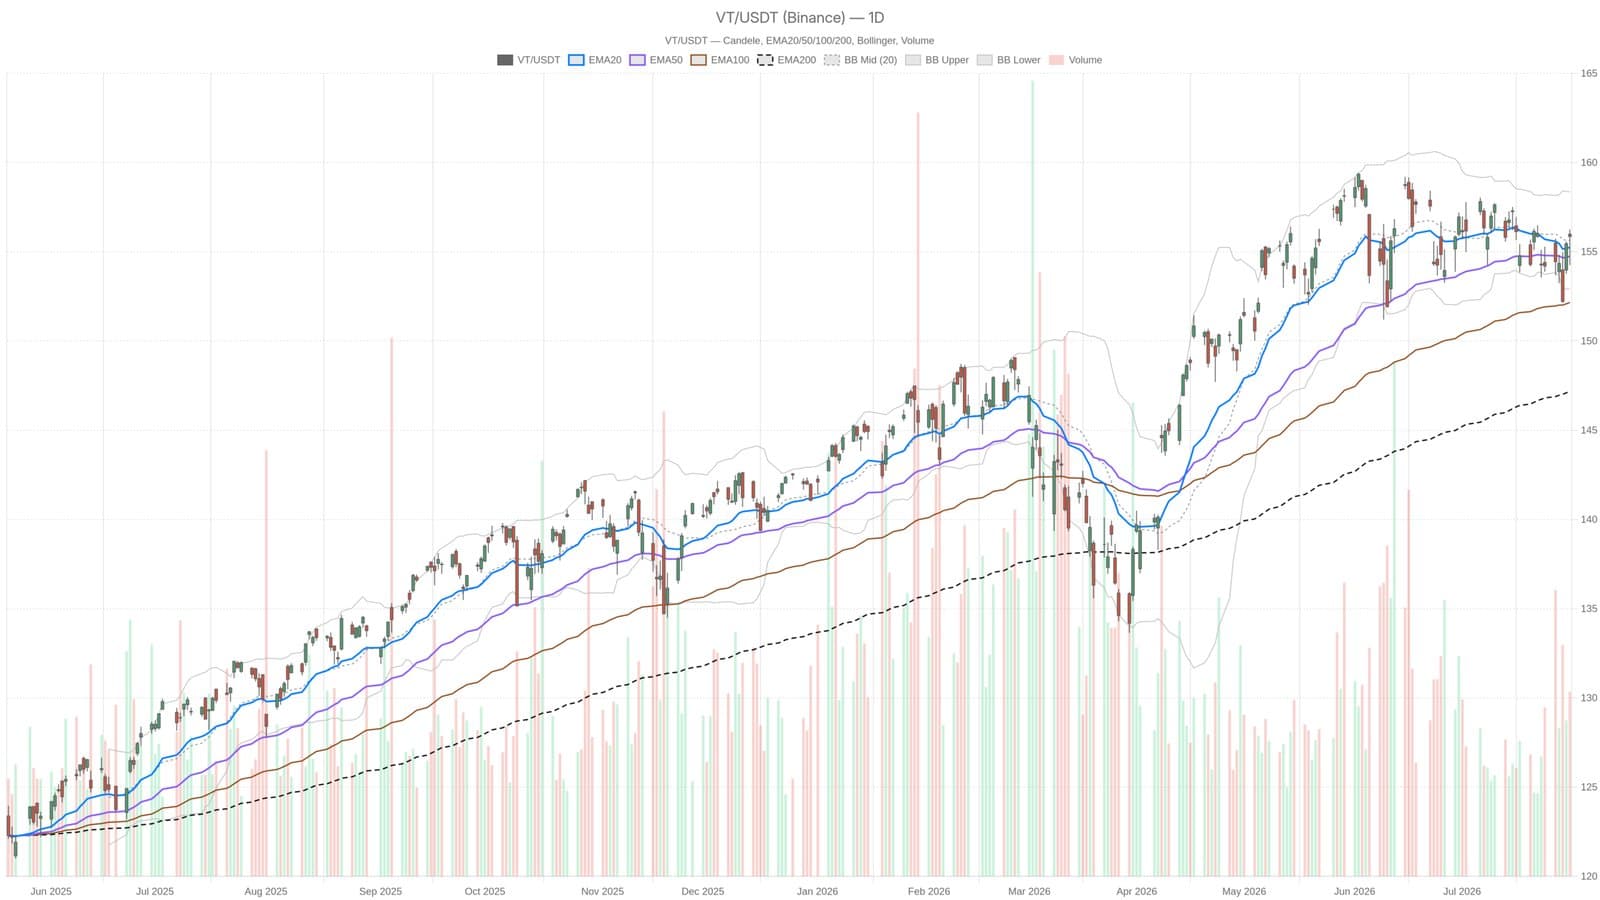
The Vanguard Total World Stock Index (VT) closed at 155.86 on Friday, holding just above key exponential moving averages. The EMA20 at 155.25, EMA50 at 154.74, and EMA200 at 147.18 remain aligned in a bullish formation, confirming the ongoing uptrend. Despite this, short-term momentum is showing signs of weakening.
Looking closer, the daily Relative Strength Index (RSI) sits near neutral at 51.85, indicating there's still room for the price to move without reaching overbought or oversold levels. However, the Moving Average Convergence Divergence (MACD) histogram is negative at -0.09, signaling cooling momentum beneath the surface.
Price action is currently testing resistance at 156.66, with support nearby at 154.66, creating a tight range. Meanwhile, Bollinger Bands are contracting, suggesting the market is consolidating and preparing for a potential breakout or breakdown. This pattern is typical toward the later stages of a rally when momentum fades but the trend remains intact.