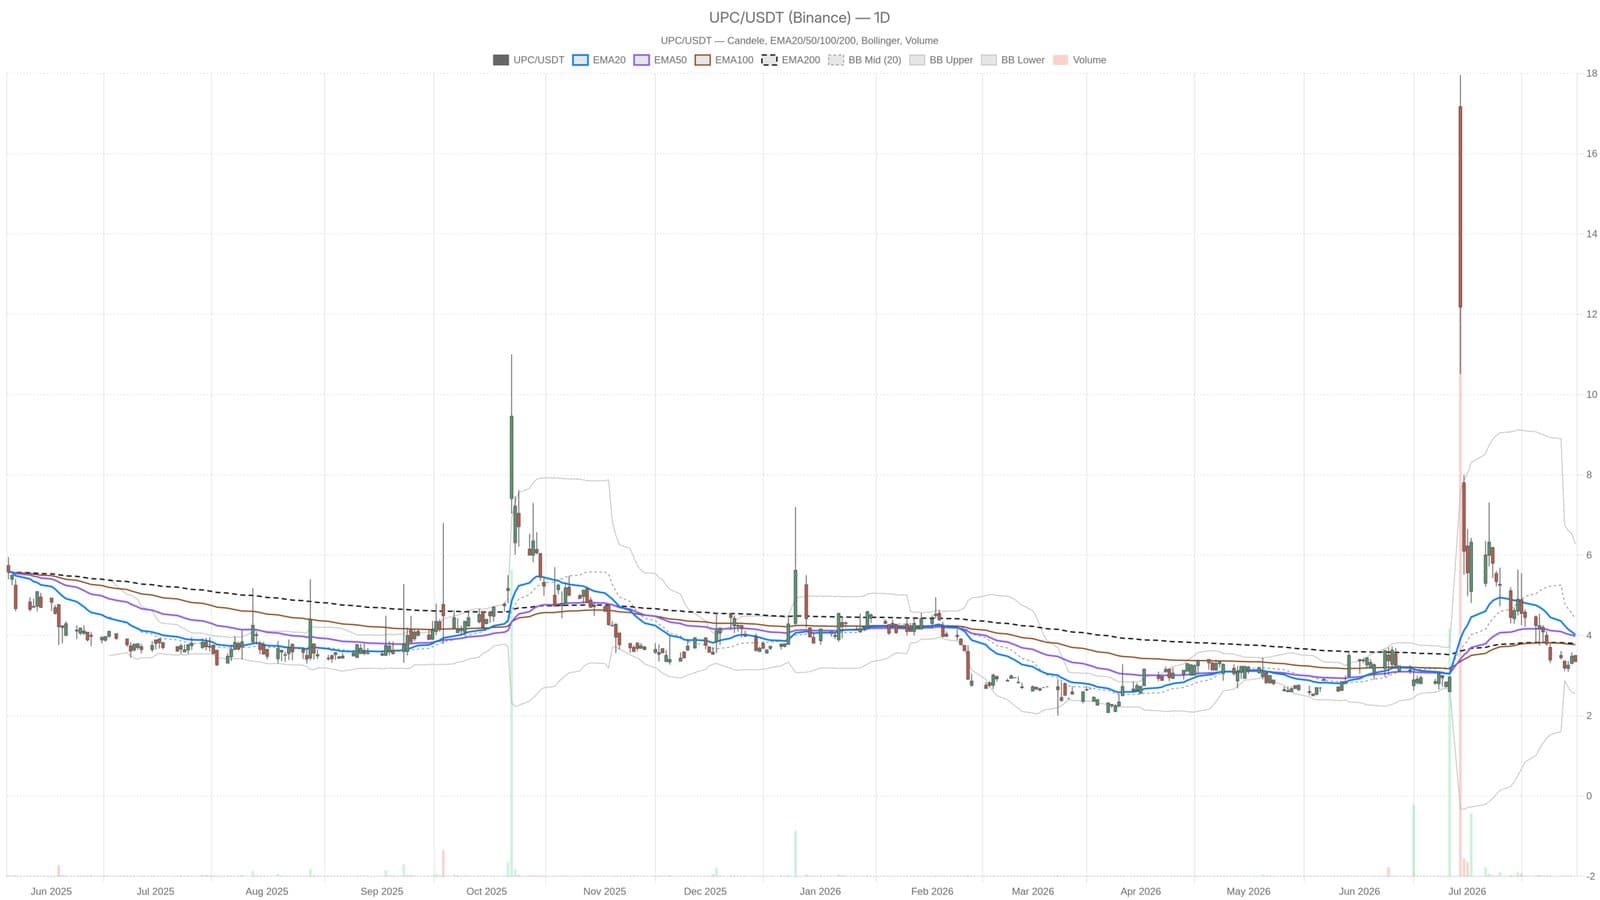
Universe Pharmaceuticals Inc’s stock closed July at $3.35, slipping beneath all major exponential moving averages. The EMA20 stands at $4.02, EMA50 at $3.98, and EMA200 at $3.80, marking a clear bearish setup. This gap between price and resistance levels suggests sellers are firmly in control for now.
Technical indicators amplify the downtrend signal. The daily MACD histogram registers -0.19, pointing to accelerating bearish momentum with no hints of slowing. Meanwhile, the RSI rests at 43.41, showing the stock is far from oversold territory, leaving space for further declines. On a shorter timeframe, a breakdown below $3.25, the 15-minute support, could push prices toward the lower Bollinger Band near $2.55.
The daily chart tells a consistent story. The July 31 session opened at $3.50 but closed at $3.35 with the opening price acting as resistance throughout, indicating steady selling pressure. Trading volume was light at 164 units, reflecting a lack of strong conviction from buyers or sellers but enough to keep the bears dominant.
Until the stock manages to reclaim the EMA200 at $3.80 a roughly 13% rise it will remain structurally weak. Investors should keep an eye on this level as a potential pivot point for any rebound attempts. The selling pressure visible here echoes broader market caution, echoing trends seen in sectors like fintech, where companies have been navigating volatile shifts.
This material is for informational purposes and does not constitute financial advice.