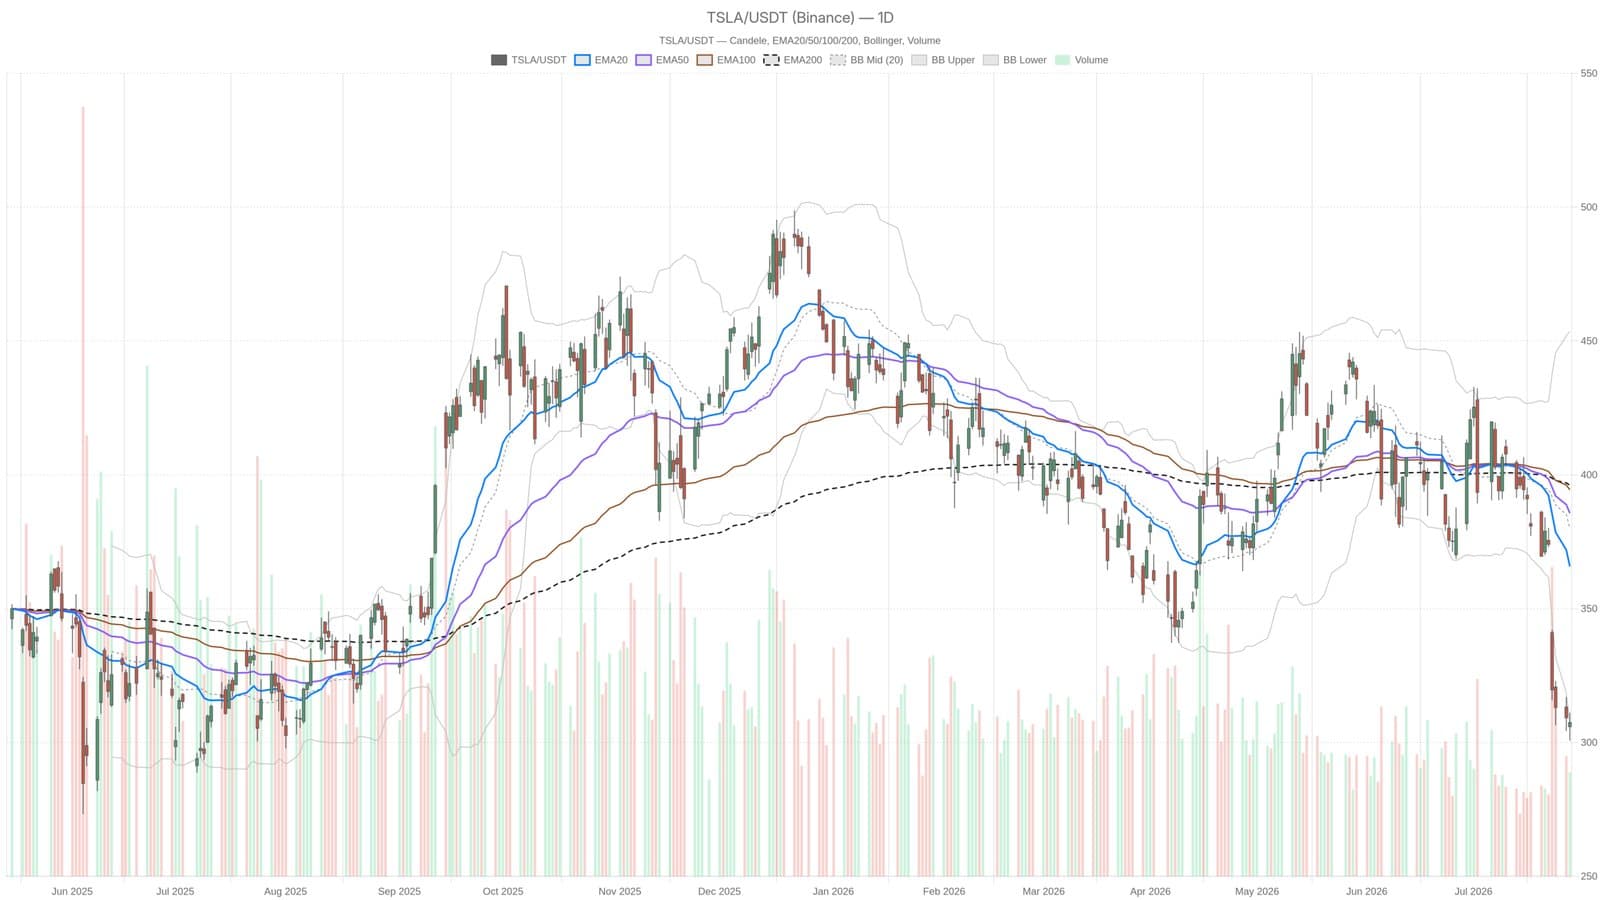
Tesla’s stock hovered just above $307 on July 28, dangerously close to breaking the $300 mark. Technical signals point to a sustained bearish trend, with key moving averages towering far above the current price, reinforcing the selling pressure that's been building for months.
Bearish Momentum Dominates Tesla's Chart
The stock trades well below its 20-, 50-, and 200-day exponential moving averages, which stand at $365.79, $385.67, and $396.11 respectively. This stacked alignment leaves little room for optimism. The MACD indicator confirms accelerating downside momentum as its histogram dips deeper into negative territory, now at -9.65. The relative strength index (RSI) has plunged to 27.03, signaling an oversold condition, but oversold doesn’t guarantee an immediate rebound; it only suggests that continued heavy selling may become harder to sustain.
Key Support Levels and Volatility Signals
The stock price clings right above the lower daily Bollinger Band at $306.47, a sign of extreme volatility and stress rather than a typical correction. The band spread from roughly $307 to the upper band near $453 reflects how far Tesla has deviated from its statistical average. Daily pivot points suggest immediate support at $301.70, meaning a breach below $300 could trigger further declines. Short-term momentum hints at some deceleration, as the hourly MACD has recently turned positive, but the bigger picture remains firmly bearish.
This content is for informational purposes and should not be taken as financial advice.