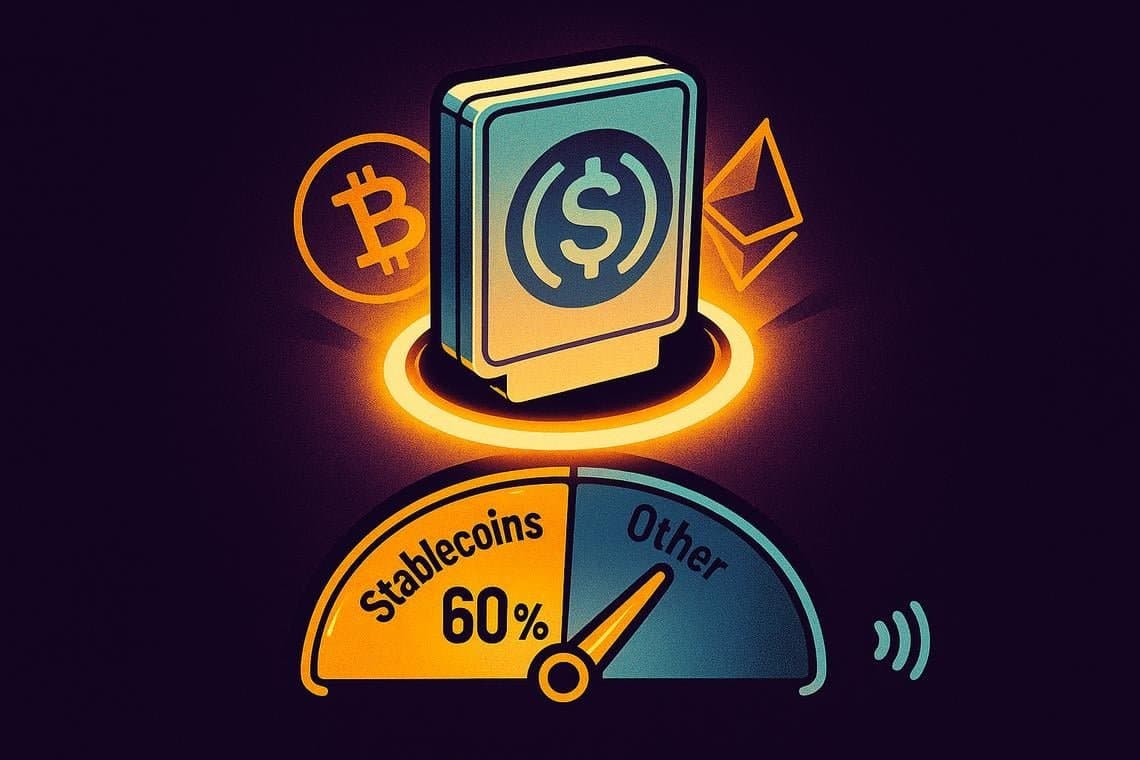
Stablecoins went from 43% to 60% of all on-ramp volume between the second half of 2025 and the first half of 2026, according to transaction data published by payment infrastructure firm Mercuryo. That is not a gradual drift. In a single six-month window, stablecoins crossed the majority line and left every other asset class well behind.
The macro context matters here. The total crypto market cap dropped roughly 30% in H1 2026, sliding from $2.96 trillion to $2.08 trillion. Trade tensions, delayed rate-cut expectations, and capital rotating back toward equities pushed risk appetite down hard. When markets compress like that, money tends to find the least volatile shelf it can. USDT and USDC absorbed that demand almost entirely.
What makes the shift look structural rather than incidental is that all three key metrics moved together. Volume share climbed. Transaction count share rose from 33% to 41%. And average order size grew 28% half-over-half. Three indicators pointing the same direction at the same time rules out a one-off spike.
New users skipped Bitcoin and went straight to digital dollars
The new-user data is the sharpest part of the picture. In H1 2026, 47% of people making their first purchase through Mercuryo chose a stablecoin, up from 33% in the prior period. That is a 14 percentage point jump in a single half-year. Repeat users shifted by roughly 8.5 points over the same stretch, so newcomers actually moved faster than veterans. Nearly one in two people entering crypto through Mercuryo in early 2026 started with a digital dollar, not Bitcoin at 12.6% of volume, not Ethereum at 13.3%.
Both of those legacy assets lost ground. Ethereum's volume share fell from 19.5% to 13.3%. Bitcoin dropped from 16.1% to 12.6%. The numbers suggest stablecoins are no longer a parking spot between trades. They are increasingly the primary entry point, used for cross-border transfers, fast settlements, and holding value outside volatile markets.
On the payments side, cards drove 66% of on-ramp volume despite accounting for only 42% of purchase count, which means card users spent more per transaction. Mobile wallets handled 50% of transactions but saw their volume share shrink from 37% to 29%. And 90% of all purchases happened on mobile devices. Android users' average order size grew 29% over the period, outpacing iOS users who came in at 17%.
This article is for informational purposes only and does not constitute financial advice. Crypto assets carry risk; always do your own research before making any investment decisions.


