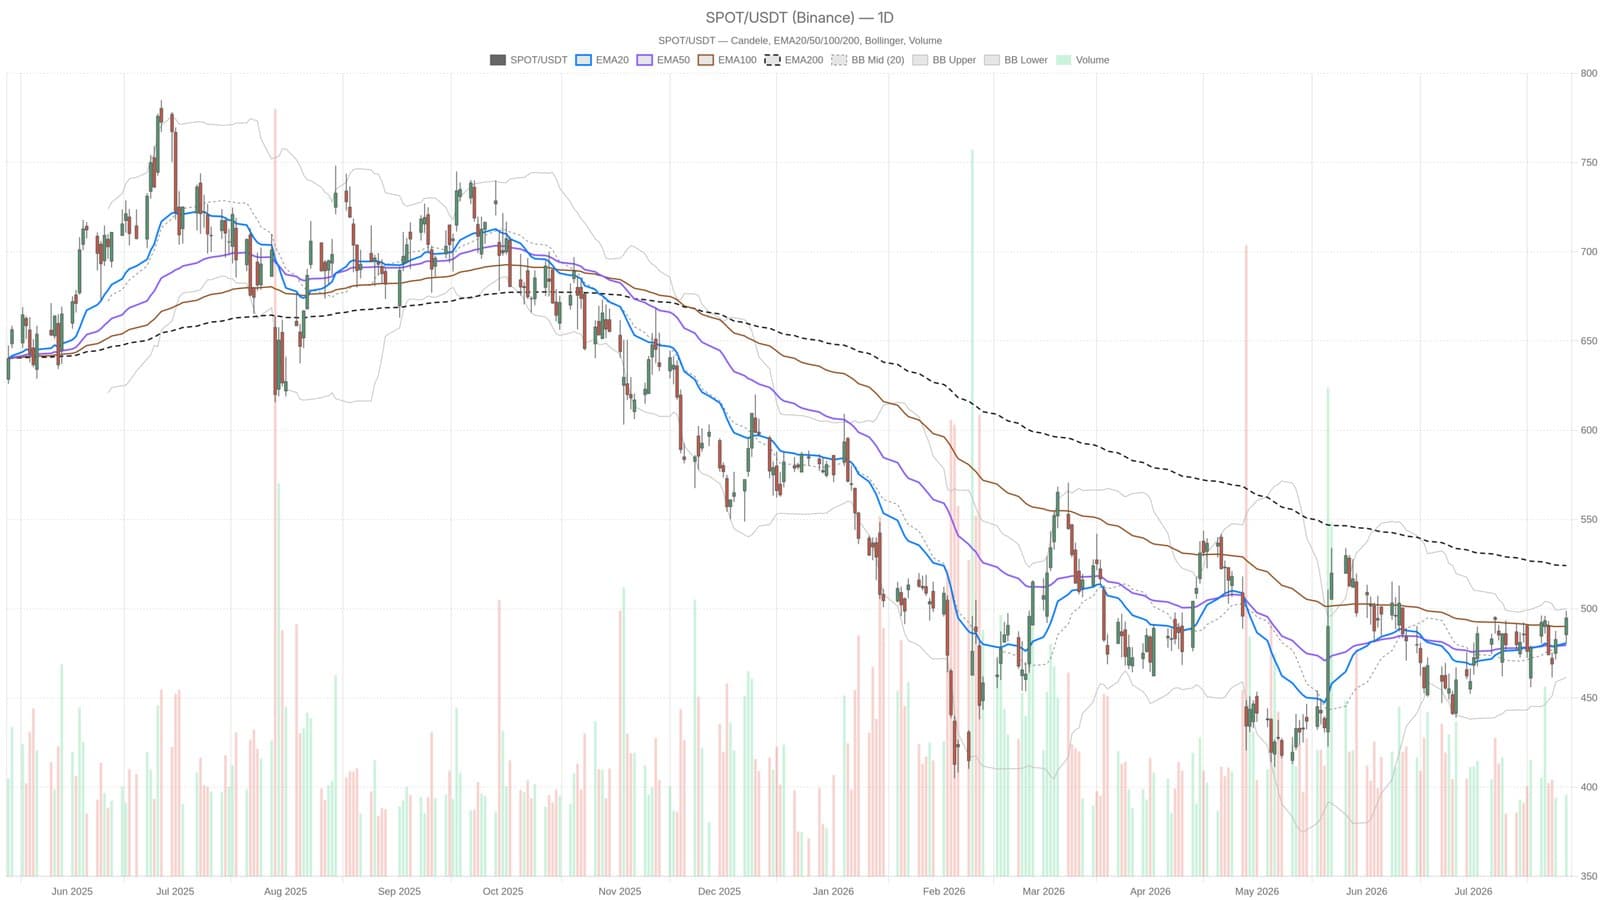
Spotify stock is quietly bouncing back, closing at $494.72 on July 27 after dipping as low as $480.69 earlier in the day. The share price is now pressing against its upper daily Bollinger Band while holding above both the 20-day and 50-day exponential moving averages (EMAs), signaling cautious optimism among traders.
Despite the daily technical regime reading as neutral, momentum indicators paint a more hopeful picture. The Relative Strength Index (RSI) stands at 56.84, indicating there’s still room to climb before the shares become overbought. The MACD line at 2.40 has crossed above its signal line at 1.76, with a positive histogram at 0.65 suggesting growing bullish momentum. Hourly EMA levels stack neatly in ascending order, reinforcing strength in the short term.
The main challenge lies at the 200-day EMA, currently resting at $524.15. This is the critical resistance zone that Spotify’s recovery must break through to confirm a sustained upward trend. Meanwhile, the support floor is firm between $479 and $481, where the 20- and 50-day EMAs converge just below the recent closing price.
Volatility remains manageable with the average true range (ATR) at $16.66. Intraday pivot points show resistance just above at $502.13 and support near $484, framing the current trading range. A decisive close above the upper Bollinger Band at roughly $499.96 could indicate the stock is ready to push higher. Otherwise, it may linger in consolidation, waiting for fresh catalysts.
Spotify’s fundamentals add weight to this technical setup. The company has generated €3.2 billion in free cash flow, a solid base that partially offsets concerns from its roughly 30% pullback since peak levels earlier this year.
This content is for informational purposes only and does not constitute financial advice.