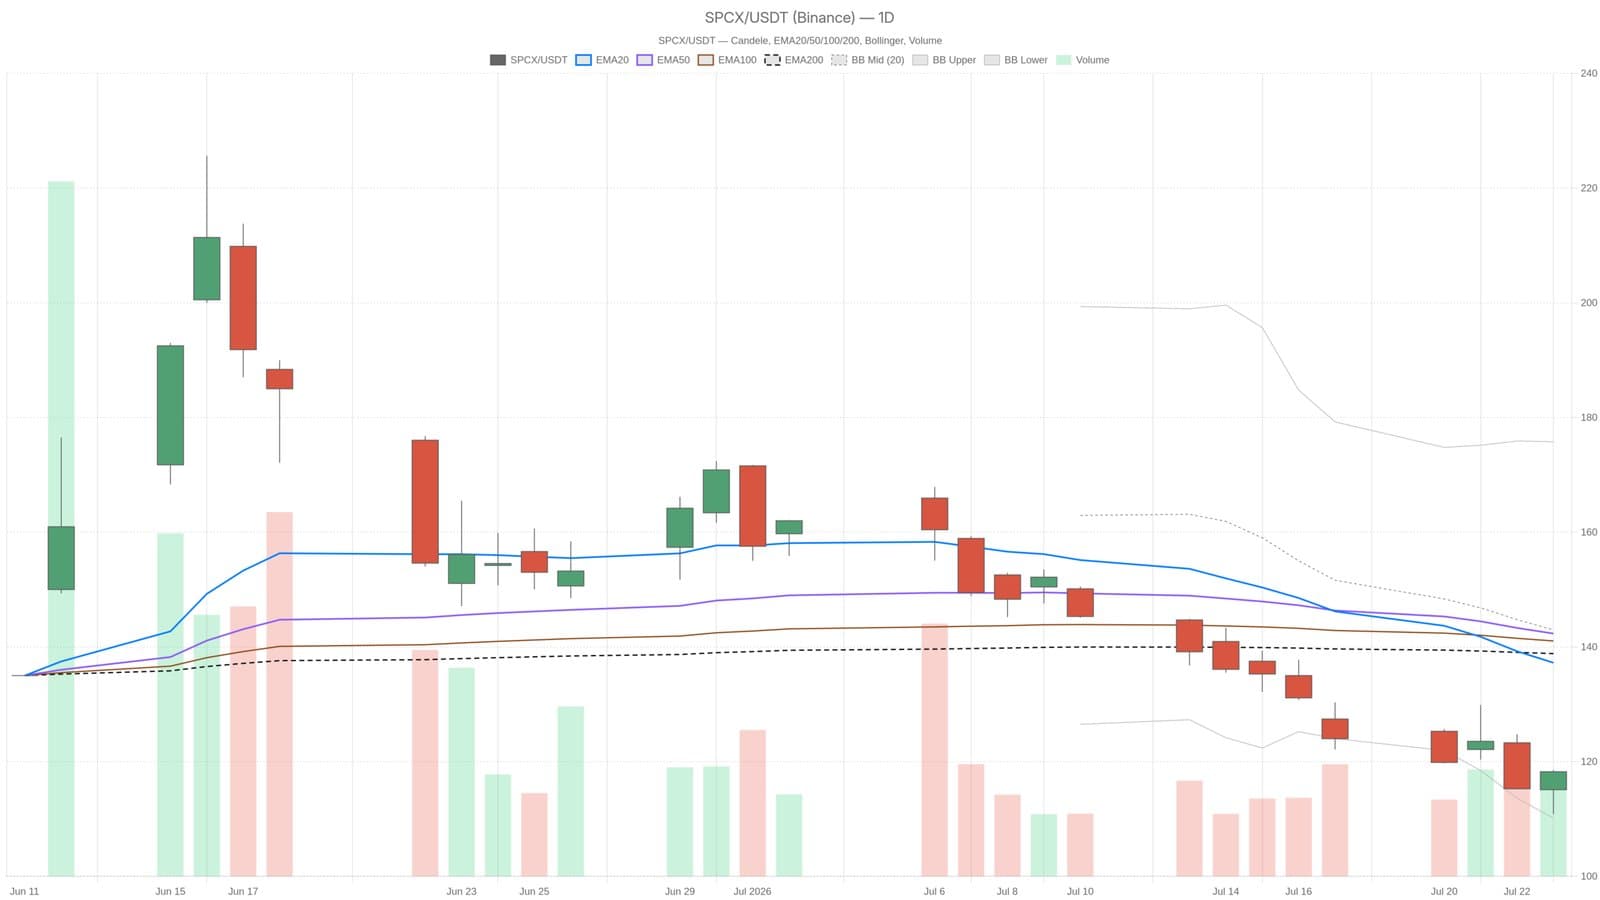
SpaceX's stock has suffered a sharp decline this July, losing about 27% of its value and slipping below its IPO price of $135. As of July 23, shares closed at $118.24, marking a significant technical setback on the daily charts.
Technical Breakdown and Market Impact
The stock is trading $19 to $24 under key exponential moving averages, including EMA20 at $137.24 and EMA50 at $142.32, highlighting a strong resistance barrier formed after its IPO peak. Momentum indicators underline the prevailing weakness: the Relative Strength Index (RSI) sits at 42.26, indicating sellers are firmly in control, while the MACD histogram shows expanding bearish momentum.
According to data from Ortex Technologies cited by Reuters, short sellers have netted unrealized gains estimated at $15.5 billion during the stock's retreat. The lower Bollinger Band at $110.12 acts as a critical support level, with recent lows nearly testing this threshold. A breakdown below it could signal further declines, while a rebound above EMA20 would be necessary for a bullish recovery of roughly 16% from current prices.
Google revealed a substantial $94.1 billion stake in SpaceX in its Q2 filing, with about $80 billion subject to short-term selling restrictions. This detail adds complexity to the stock’s trading dynamics amid the volatility, which daily average true range (ATR) measures at $8.43, reflecting wide daily price swings.
Short-term pivot points place support near $113.21 and resistance around $120.91, with the stock closing slightly above resistance on July 23, offering a modest short-term reprieve.