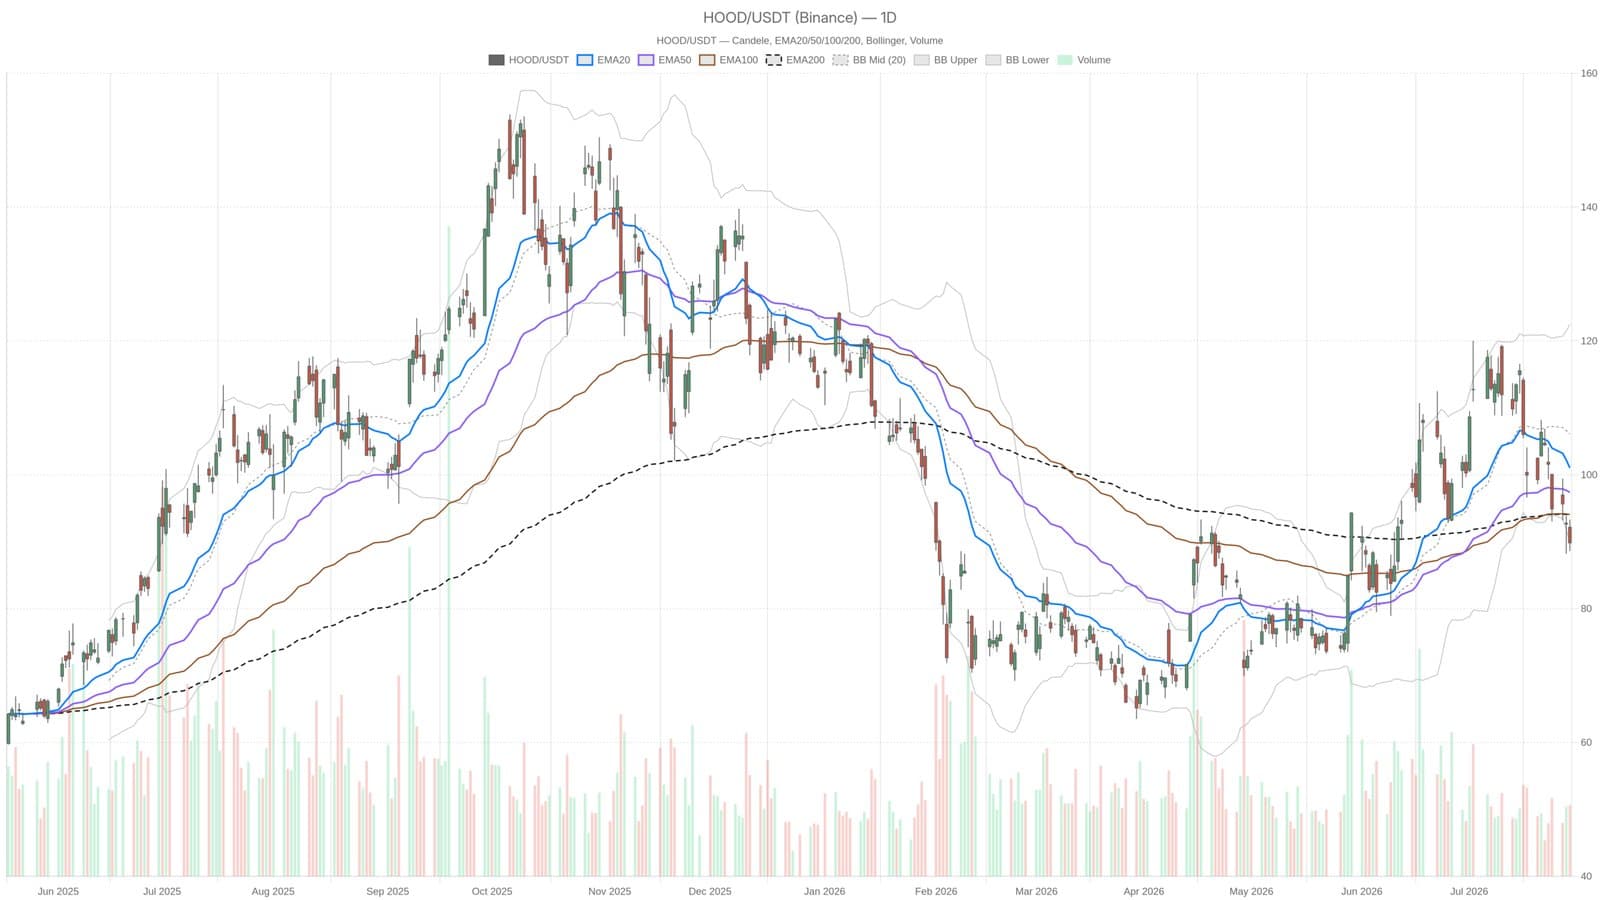
"It's a tough selloff even after a record revenue quarter," said one trader watching Robinhood’s stock action. Shares dropped to $89.84 on July 29, slipping below all major moving averages despite the fintech’s impressive $1.31 billion revenue in Q2, marking a 32% increase year-over-year. Investors seem unimpressed, pushing the price under the 20, 50, and 200-day EMAs and signaling strong bearish momentum.
Technical indicators paint a bleak picture. The Relative Strength Index (RSI) sank to 38.47, and the MACD histogram plunged to -2.81, underscoring the dominance of sellers in the stock’s near-term trend. Price levels at $101.03, $97.37, and $94.05 representing the 20-, 50-, and 200-day EMAs respectively remain well above current trading, emphasizing that this isn’t just a minor pullback. With the MACD line far below its signal counterpart and Bollinger Bands squeezing the price near the lower band of $89.74, the risk of further declines toward $87.87 intensifies unless a new catalyst emerges.
Volatility is keeping traders on edge. The average true range (ATR) expanded to $6.54, reflecting wide daily swings that could catch less experienced traders off guard. The hourly chart mirrors this pressure but shows some signs that downside momentum might be easing close to support levels. Still, with the broader market dynamics, conviction remains fragile.
Robinhood’s struggles echo broader fintech and trading platform challenges amid shifting investor sentiment. The stock’s heavy discount despite growing revenue highlights tension between fundamental strength and technical weakness. Meanwhile, other fintech advances like tokenized funds gaining regulatory approval hint at where innovation is moving, even as Robinhood faces market headwinds.
This content is for informational purposes only and does not constitute financial advice.