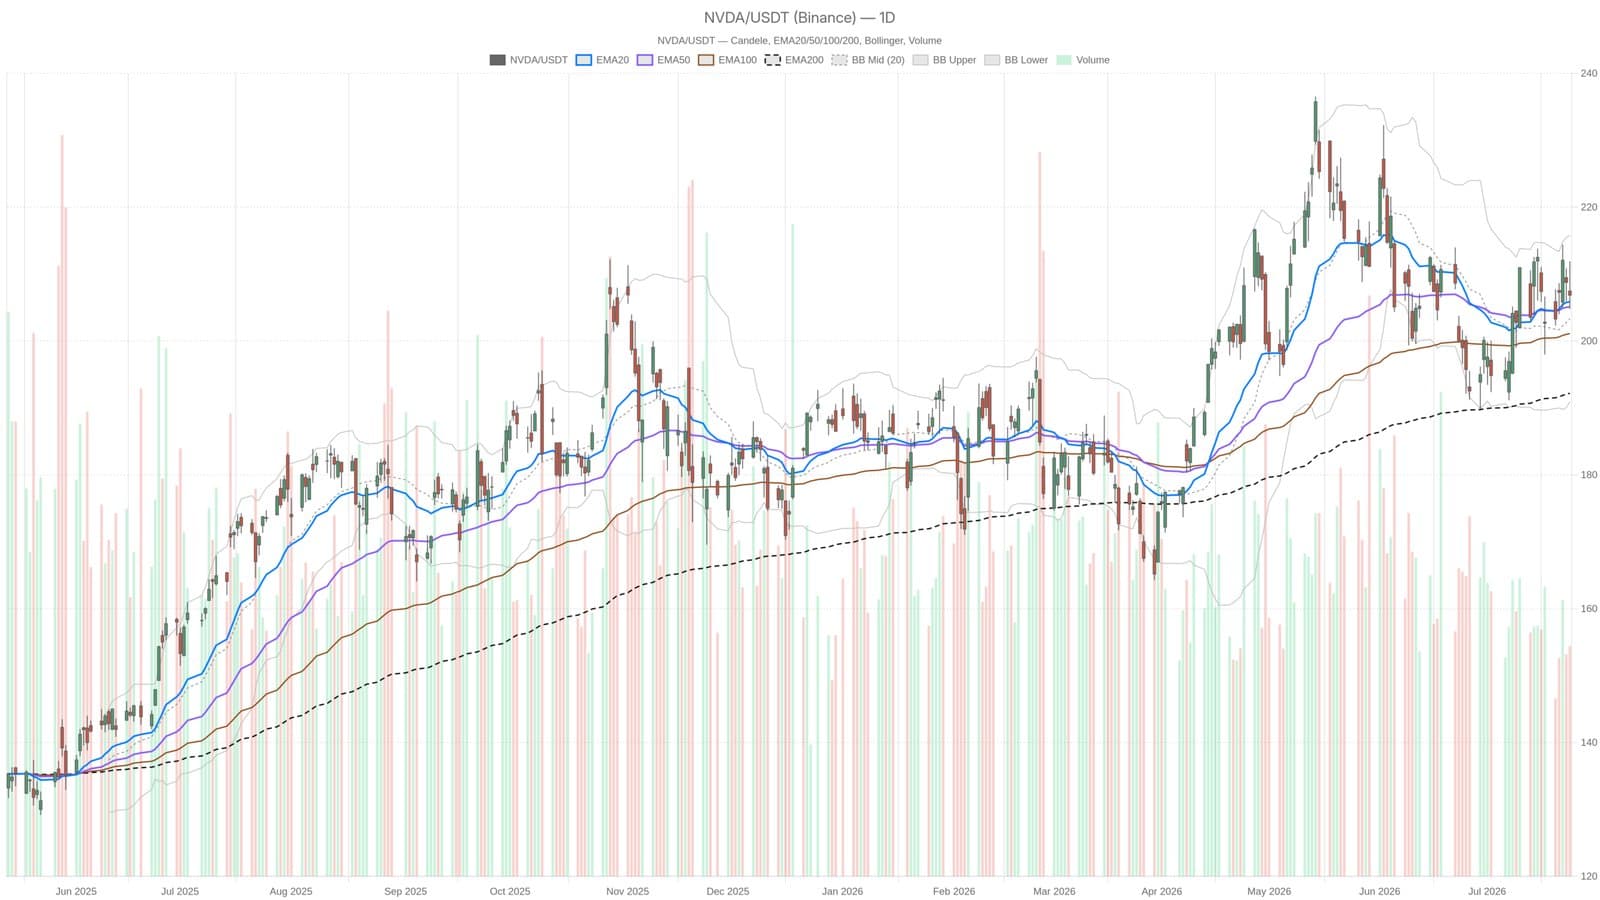
Nvidia’s stock is showing a solid daily uptrend, trading above key moving averages at $206.84 as July draws to a close. Yet the short-term signals paint a more complex picture, with hourly charts indicating a pause or even pressure on intraday momentum. This tug-of-war between daily strength and hourly caution is catching the eye of traders and investors alike.
Daily Uptrend Holds, But Momentum Isn’t Exploding
On the daily chart, Nvidia has established a confident bullish stance. The price sits comfortably above the 20-, 50-, and 200-day exponential moving averages (EMAs), which are aligned in a rising sequence an indication of sustained strength. The 20-day EMA stands at $205.87, the 50-day at $205.11, and the 200-day much lower at $192.19.
Momentum indicators support this view. The Moving Average Convergence Divergence (MACD) line is at 0.84, well above its signal line of 0.08, producing a positive histogram of 0.77. This suggests buyers remain in control, though the pace isn’t accelerating dramatically. The relative strength index (RSI) around 51 hints at room to climb without becoming overbought.
Intraday Signals Signal a Pause
Still, hourly charts raise flags. Nvidia’s price has slipped below the 1-hour EMA20 ($208.51) and EMA50 ($207.72), signaling a neutral short-term regime rather than outright bullishness. The 1-hour MACD shows divergence on the downside, and the stock’s intraday levels are hovering just under the key $207.85 pivot point. If Nvidia fails to hold above this line, a pullback toward the support level at $203.80 may be in store.
This subtle tension may reflect broader market jitters or profit-taking after a strong run-up, especially as investors gauge the impact of Nvidia’s recent $1 billion commitment to NAVER’s AI data center infrastructure in South Korea, a move amplifying its AI ambitions.
Valuation and Market Context
Nvidia's market capitalization nears the $250 billion mark, largely fueled by expectations tied to OpenAI’s growth and the AI boom. This optimism faces healthy skepticism from market players like Michael Burry, who have voiced concerns about whether the stock fully justifies this lofty valuation.
The volatility remains steady, with the average true range (ATR) at 7.6 pointing to normal daily price swings. Bollinger Bands suggest the upper boundary near $215.74 as a resistance ceiling, while the lower band at $190.93 offers downside risk limits.
Should Nvidia decisively breach the $207.85 pivot on strong volume, bulls will likely push for higher targets near $210.90 and beyond. But a failure here could invite sellers to test the $203.80 support level, setting up a critical battle for control.
These conditions reflect the intricate dance between long-term enthusiasm in AI stocks and near-term tactical moves by traders adjusting their positions.
This material is for informational purposes only and does not constitute financial advice.