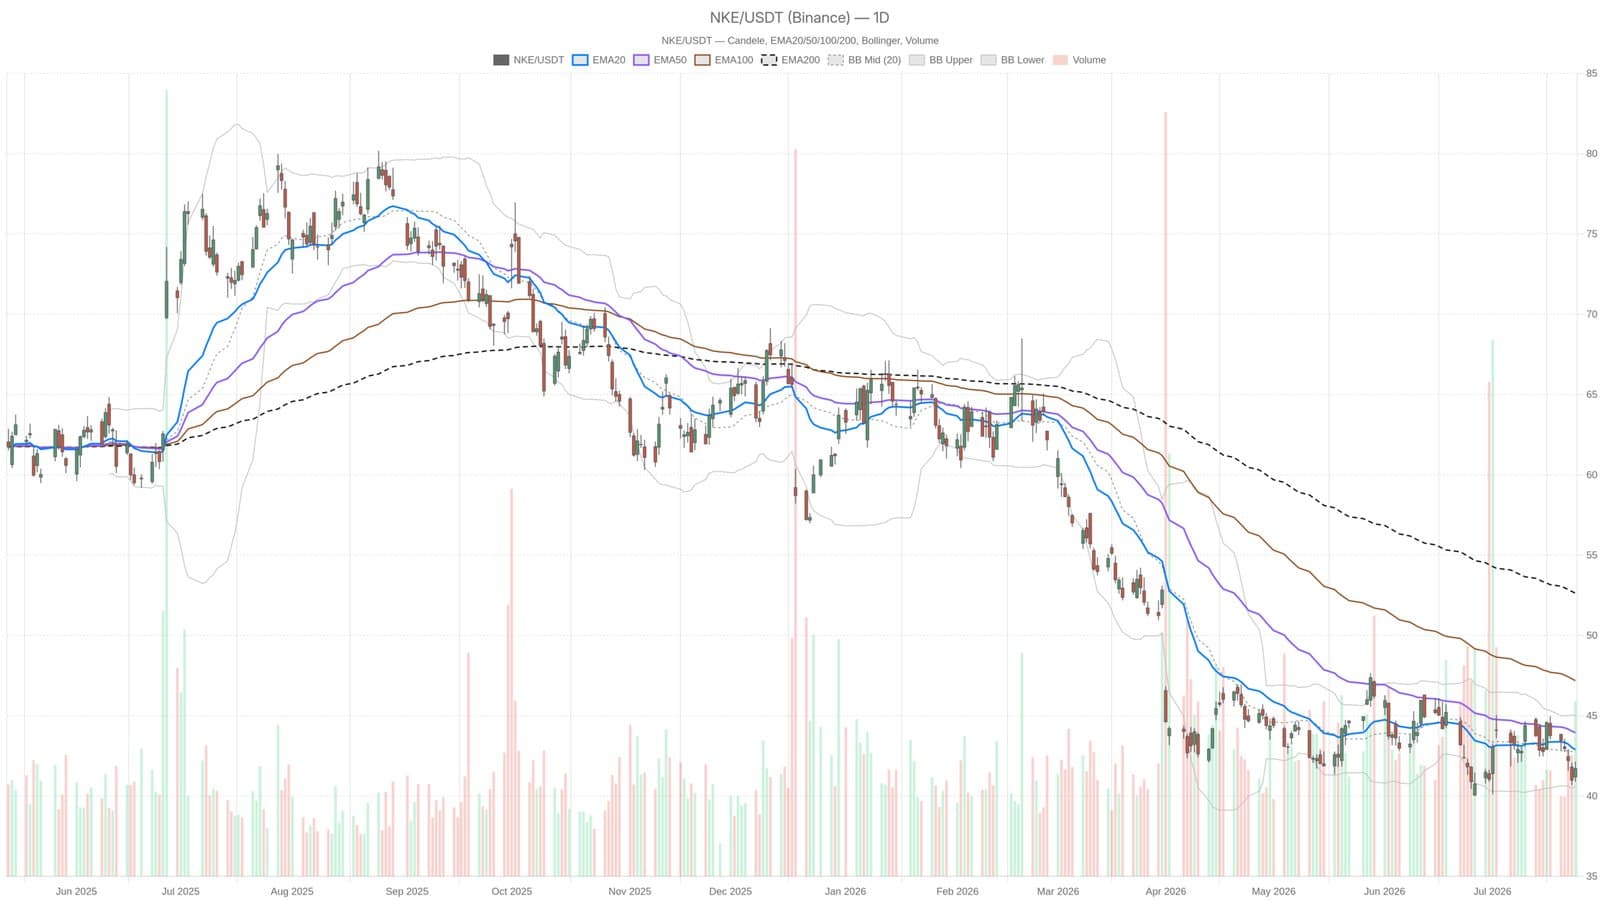
Nike shares closed at $41.70 on July 24, 2026, plunging below all major exponential moving averages (EMAs), signaling persistent bearish momentum.
The stock is trading under the EMA20 at $42.89, EMA50 at $43.95, and the EMA200 at $52.63, a pattern that typically indicates downward pressure without immediate signs of recovery.
Technical indicators add to the cautious outlook. The Relative Strength Index (RSI) stands at 43.25, showing weak momentum but not reaching oversold levels, suggesting no immediate bottom is forming.
Meanwhile, the Moving Average Convergence Divergence (MACD) remains negative, with its line at -0.38 below the signal line at -0.23, reinforcing ongoing bearish sentiment.
Nike faces additional headwinds beyond charts. The company will cease all online sales through distributor Pou Sheng in China starting January 1, 2027, tightening its footprint in a key market.
Compounding issues, Vietnamese authorities recently seized nearly 50,000 pairs of counterfeit Nike footwear during a factory raid in Ho Chi Minh City, raising concerns about brand integrity in Southeast Asia.
The Bollinger Bands reveal that Nike's price is hugging the lower band at $40.61, with the mid-band at $42.80, hinting the stock is struggling to hold its ground rather than breaking out to the upside.
Pivot analysis places the daily pivot point at $41.58, with Nike closing just above it at $41.70; this narrow margin confirms the fragile position of the stock.
On the hourly chart, the bearish trend persists with the price below EMA20, EMA50, and EMA200 on this timeframe as well, though some minor signs of slowing selling pressure have emerged.