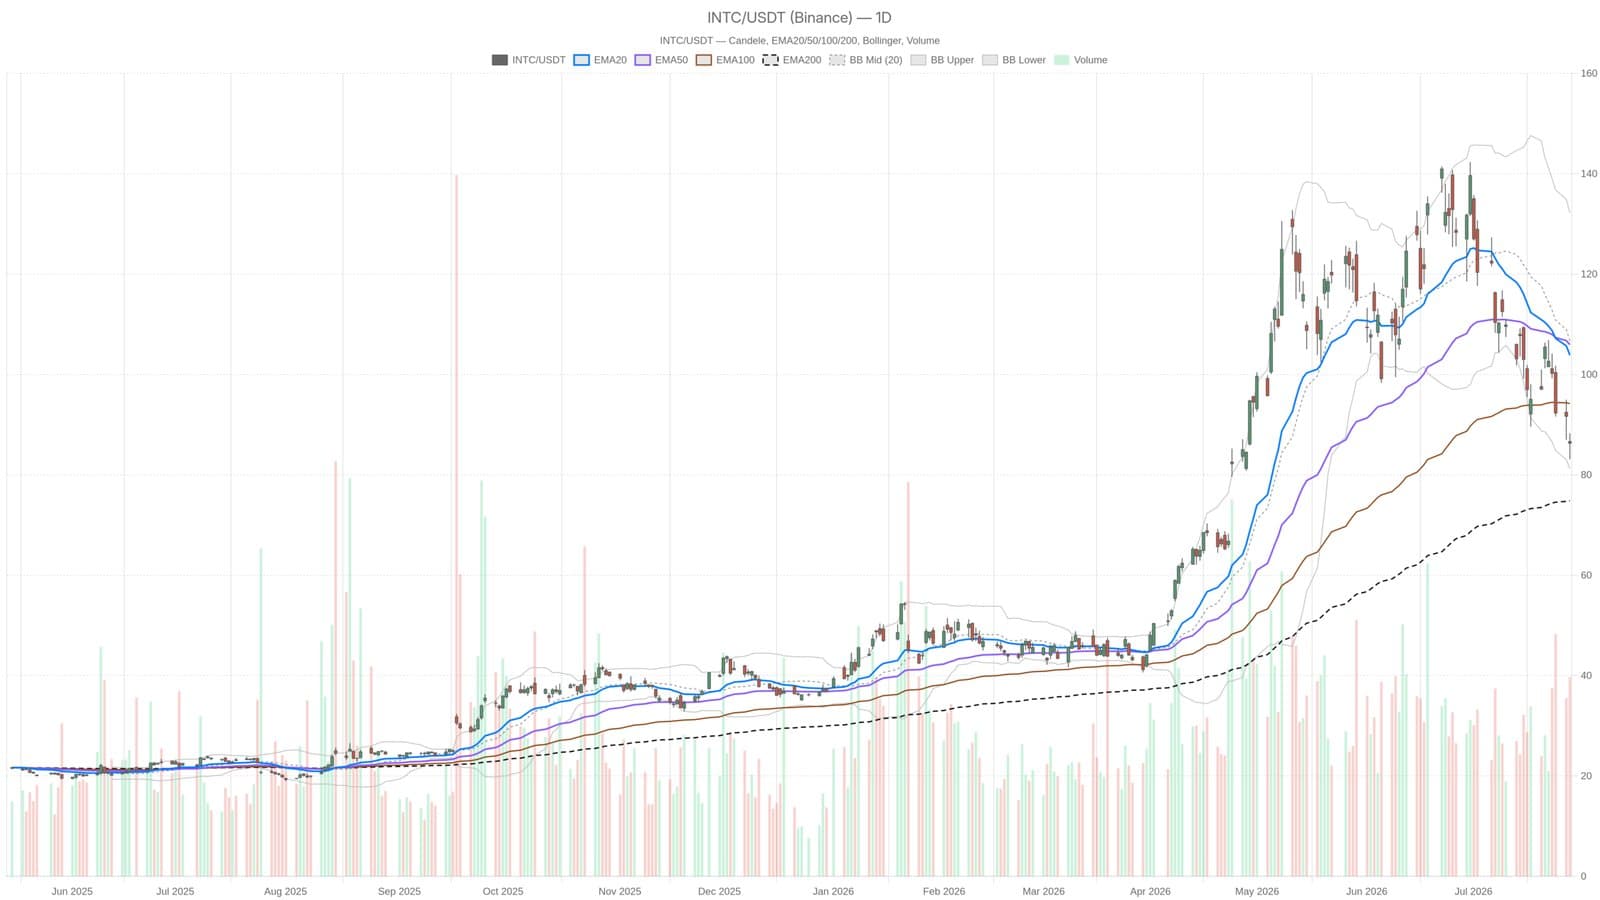
Intel's stock has fallen sharply, sliding close to 39% below its June peak while analysts continue to upgrade their fair value estimates. The chipmaker set a 15-year revenue record but still trades well under key moving averages, signaling that the sellers remain firmly in control.
Technical Setback Amid Rising Valuations
On July 28, Intel closed at $86.30, a price far from the EMA20 and EMA50 levels, which stand at $103.85 and $105.94 respectively. This gap of nearly $18 reflects sustained selling pressure rather than a mild correction. The only technical support lies near the EMA200 at $74.83, which acts as a safety net for the long-term outlook. Falling below $83.51 would expose the stock to a sharper slide toward this deeper support zone.
Momentum and Volatility Paint a Mixed Picture
Momentum indicators add tension. The daily relative strength index (RSI) rests around 33.76, dangerously close to oversold territory a warning that the share price might be primed for a brief technical bounce. However, the moving average convergence divergence (MACD) paints a more cautionary story. With a negative histogram of -2.02 and the MACD line lower than its signal line, the downward momentum has not yet eased. Meanwhile, Intel's average true range (ATR) remains elevated at 7.46, underlining volatile price swings that traders must approach carefully.
Despite technical pressure, analysts have pushed their fair value for Intel significantly higher, from $88.61 to $115.65, with targets now clustered between $120 and $200. This disconnect between market price and analyst projections spotlights the challenge for investors navigating a strong fundamental backdrop overshadowed by bearish market sentiment.
material is for informational purposes and not financial advice