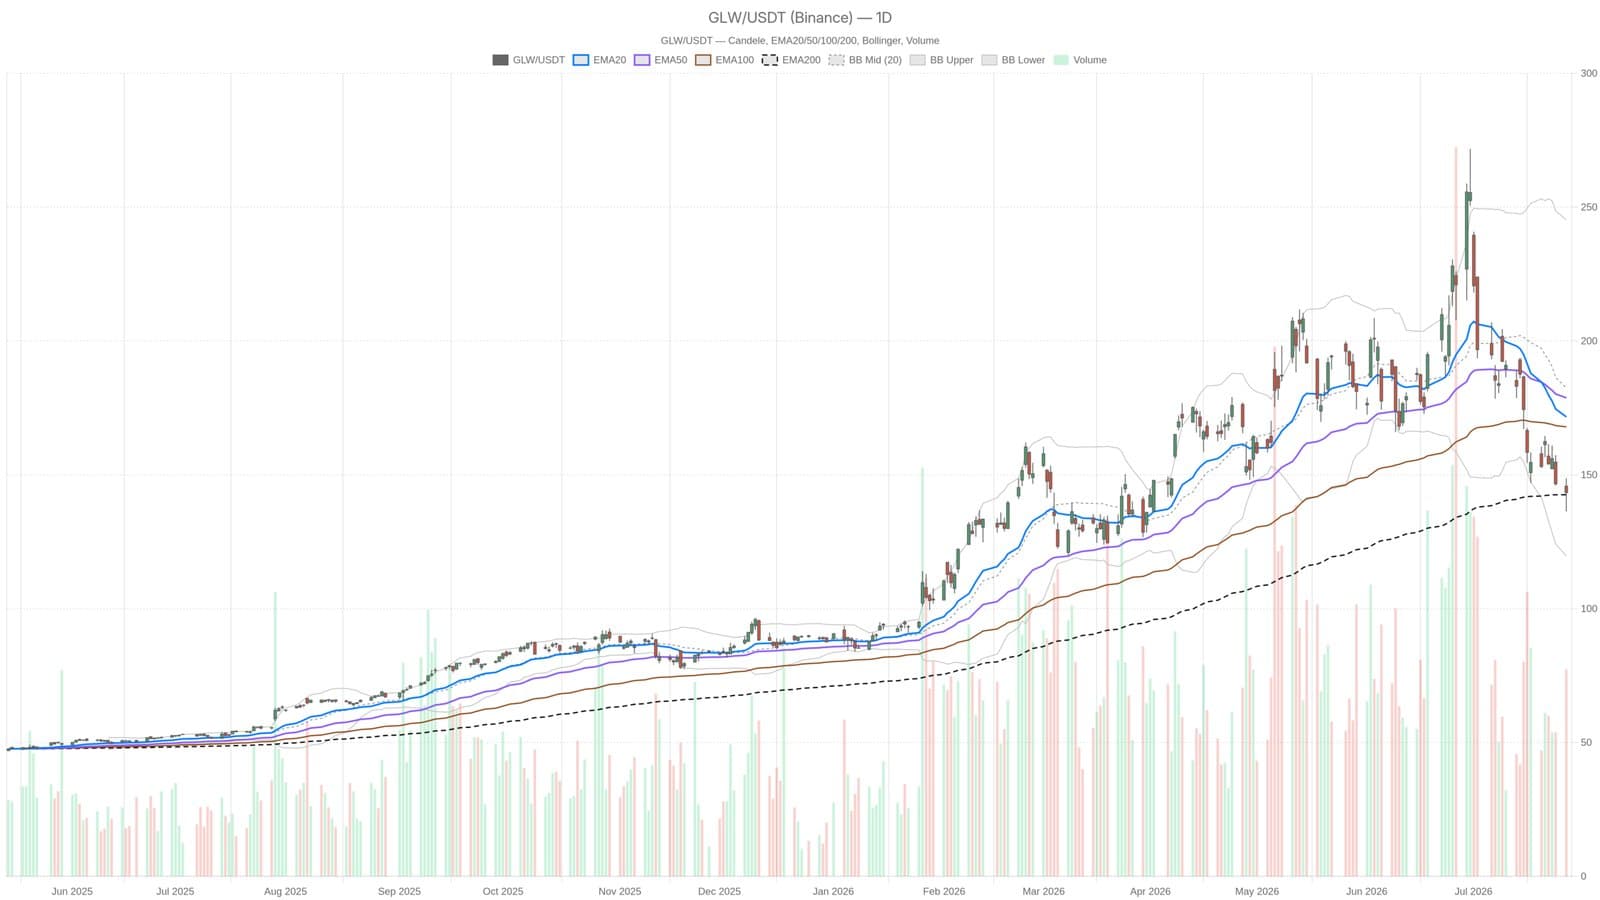
"We’re watching GLW closely as it tests the $142.57 level," said one market analyst, reflecting the tension ahead of the company's Q2 earnings release. On July 27, GLW shares closed at $143.36, precariously sitting just above the 200-day EMA, a key technical support line. The stock’s position well below its 20-day and 50-day moving averages, at $171.63 and $178.76 respectively, signals persistent selling pressure that has dragged prices significantly lower over recent months.
The technical indicators reveal a bearish trend that’s hard to shake. The daily RSI sits at 35.44, close to oversold territory but still with room to fall further. This suggests that momentum remains tilted towards sellers rather than signaling an imminent reversal. The MACD adds to the bearish picture, with a widening negative histogram indicating that downward momentum is accelerating rather than easing off. Meanwhile, the Bollinger Bands on the daily chart are extremely stretched, with the price near the lower band at around $119.71, underscoring heightened volatility.
The upcoming earnings report, expected to show earnings of about $0.76 per share, represents a make-or-break moment. With the average true range at $12.17 daily, the stock could swing sharply in either direction. Fundamental tailwinds from AI-driven fiber demand and strength in optical communications provide some hope for investors. However, the question remains whether GLW can hold its ground at the 200-day EMA or if this support will give way to further losses.
Investors will be watching closely as the earnings data arrives, knowing the results could either provide a catalyst for recovery or confirm the bearish trend that has dominated the charts. The struggle between technical resistance and fundamental potential creates a high-stakes environment for GLW shares in the near term.
This content is provided for informational purposes and does not constitute financial advice.