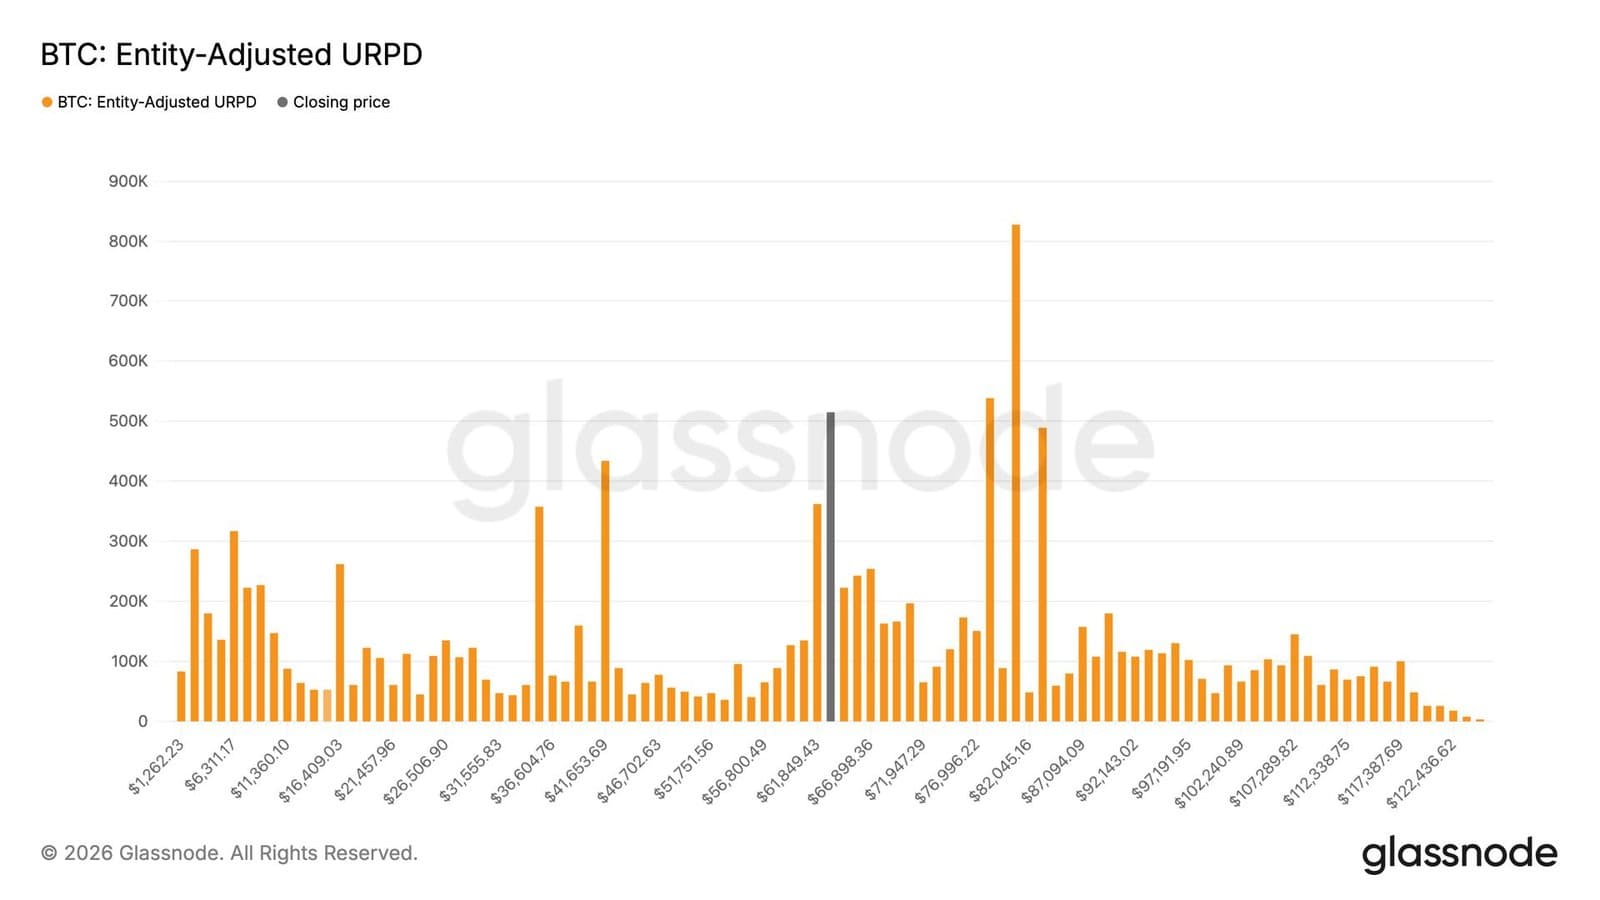
Glassnode just flagged something worth watching. More than half a million bitcoin, roughly 3% of all coins in circulation, is piled up around the $63,000 price level. That concentration makes this zone the second-largest supply cluster on the entire price chart, beaten only by the $78,000 to $82,000 band where bitcoin peaked back in May.
The math here matters. Bitcoin has been bouncing between $60,000 and $67,000 for weeks now. During that sideways churn, coins worth billions kept changing hands at those levels. Using Glassnode's Entity-Adjusted UTXO Realized Price Distribution tool, which maps how much supply last moved at each price point, the data shows roughly 362,000 coins stacked near $61,000 too. These aren't random numbers. They tell you where buyers stepped in before and might step in again.
Everyone's accumulating at once
What makes this more interesting is who's buying. Retail investors are the most aggressive right now at these prices. But it's not just small players hunting for a bargain. Whales holding at least 1,000 BTC are accumulating with similar intensity. Every other wallet cohort is also in buying mode. That kind of synchronized accumulation across different investor sizes doesn't happen by accident.
Bitcoin is also trading almost exactly at its 200-week moving average, currently sitting at $63,657. The actual price is $63,822. That's textbook technical support territory. The 200-week average tracks the asset's mean price over the past four years. When price hugs that line this tightly while buyers are stacking coins across the board, it usually signals a floor has formed, at least for the near term.
Bitcoin inched up 0.4% on the session, with options traders now paying closer attention to these accumulation signals.