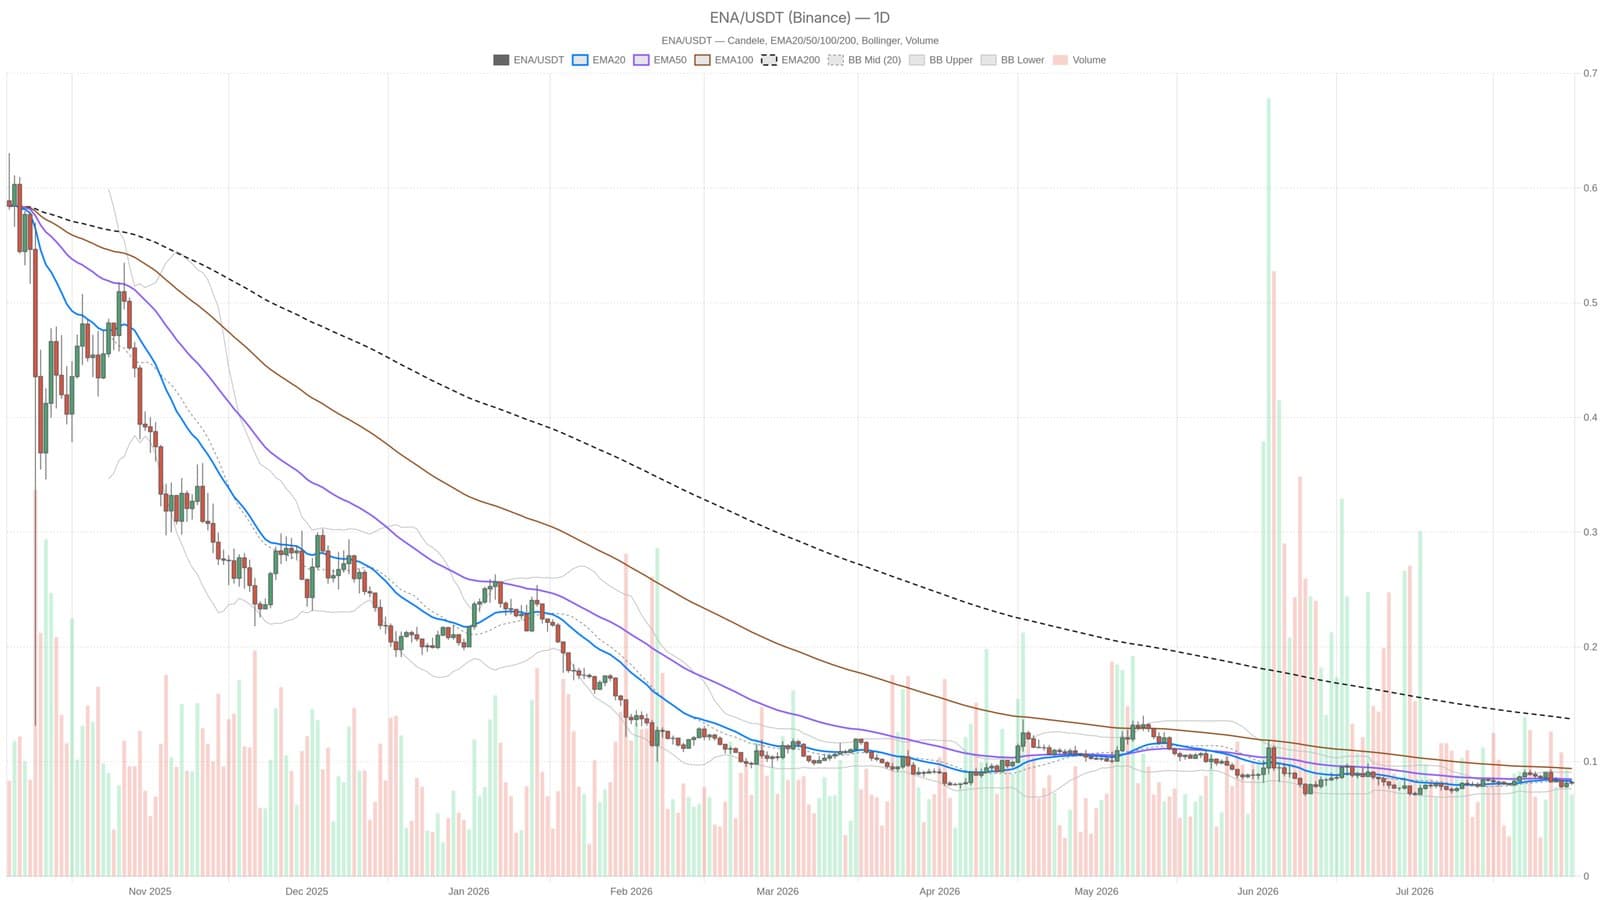
Ethena (ENA) remains stuck at $0.08 on July 31, 2026, clinging to a price level that reflects market fatigue amid a broader altcoin selloff. The 200-day exponential moving average (EMA) currently sits at $0.14, almost 75% higher than ENA's latest trade, highlighting how far the token has slipped from its long-term benchmark.
Technical Snapshot Paints a Silent Market
On the daily chart, ENA’s 20-day and 50-day EMAs both align exactly at $0.08, offering no dynamic support or resistance, while the relative strength index (RSI) hovers near 48.6, just below the neutral midpoint. This middling RSI level shows the token is neither oversold nor in recovery but trapped in limbo without meaningful buying pressure. The moving average convergence divergence (MACD) is flat at zero, signaling no clear momentum. Usually, a neutral MACD might suggest stability, but in today's bearish environment, it raises concerns as indecision often precedes downward moves.
Adding to this, Bollinger Bands have contracted tightly around $0.08 across multiple timeframes. Such compression rarely lasts and often foreshadows a sharp shift in volatility. Traders monitoring these bands should expect ENA to break from this narrow range soon the question remains whether it will be up or down.
Market Sentiment and Broader Context
The Fear & Greed Index is deep in Extreme Fear territory at 25, indicating reluctance among investors to re-enter risk positions. Bitcoin dominance remains above 56%, signaling that capital continues to flow into the leading crypto rather than altcoins like ENA. This cautious mood has intensified following the collapse of the Aschenbrenner AI hedge fund, which lost the bulk of its $45 billion valuation, shaking confidence in risk assets overall.
Ethena’s technical setup is a portrait of a market holding its breath. The chasm between the current price and the 200-day EMA isn’t a near-term recovery target but a reminder of how far the token has fallen structurally. Momentum indicators have gone flat in an environment that tends to favor bears, while tightly squeezed Bollinger Bands warn that an explosive price move is approaching.
This content is for informational purposes only and does not constitute financial advice.