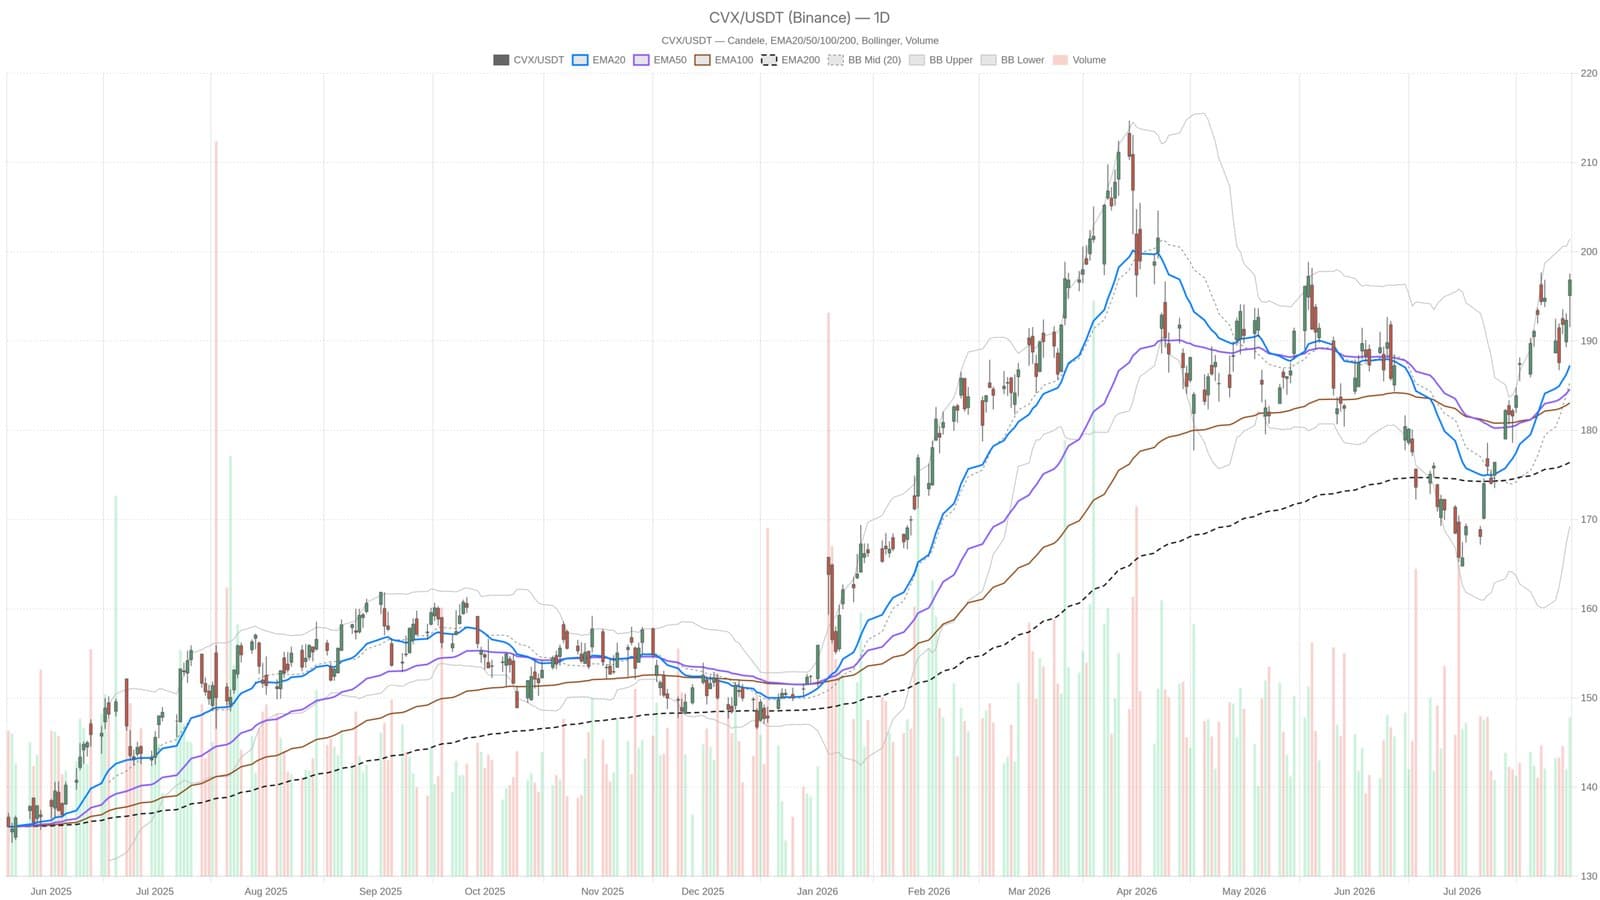
On July 31, Chevron’s stock rallied sharply following a blockbuster earnings report. The company revealed adjusted Q2 profits of $12 billion, a 287% increase from $3.1 billion a year ago. Shares closed at $196.83, trading comfortably above key moving averages.
The daily chart paints a bullish picture with Chevron’s price sitting well above its 20-, 50-, and 200-day EMAs, signaling strong support levels at $187.25, $184.59, and $176.40 respectively. This stacked alignment suggests steady momentum rather than a volatile spike.
Technical indicators back the surge. The RSI stands at 67.14, indicating sustained buying pressure without immediate overbought concerns. The MACD also confirms momentum expansion, with a positive histogram reflecting growing bullish sentiment. Meanwhile, the stock is moving toward resistance at $199.08 and the Bollinger upper band at $201.44, pointing to potential upside targets.
Volatility remains elevated, consistent with the earnings-driven move, as the 14-day average true range sits at $4.14. Key support to watch includes the daily pivot at $195.31 and $193.06. Production milestones and anticipated synergies from Chevron’s pending Hess acquisition add fundamental strength to the technical setup.
This material is for informational purposes only and does not constitute financial advice.