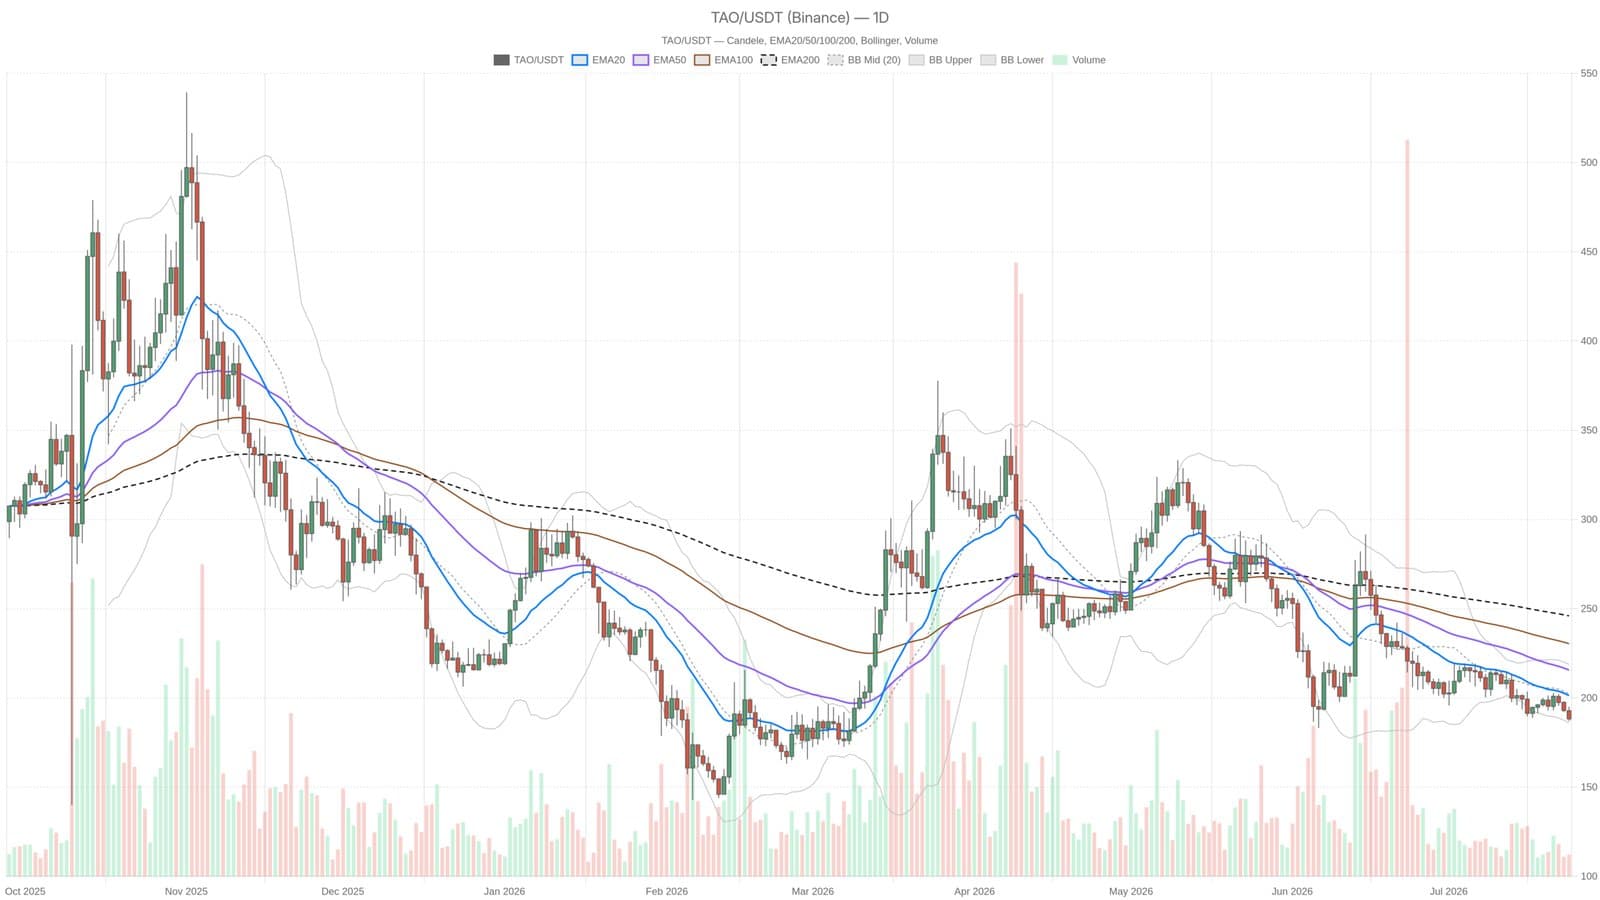
Bittensor’s price has slipped to $188.10, with every technical indicator signaling bearish pressure across daily, hourly, and 15-minute charts. This alignment is unusual: when all timeframes agree, it points to more than just noise it's a clear sign of sustained selling.
Daily Chart Reveals Strong Bearish Momentum
Looking at the daily chart, Bittensor trades far below key moving averages: EMA20 at $201.31, EMA50 at $215.60, and EMA200 at $245.97. All three averages are stacked in perfect bearish order, confirming a persistent downtrend rather than a short dip. The daily RSI sits at 35.87, just above the oversold level, showing sellers still dominate without signs of exhaustion that might invite buyers.
The MACD line remains negative and nearly flat, indicating downward momentum has paused but not reversed. Bollinger Bands add context, with the price pressing against the lower band at $185.89. This often precedes either a bounce or a further breakdown.
Daily pivot points highlight resistance and support zones: the pivot at $190.07 has already been breached, placing Bittensor in a weak technical position. Support around $185.13 is critical if this fails, expect more downside volatility given the average true range (ATR) of 8.46, which suggests daily swings of $8 to $10 are common.
Hourly Indicators Deeply Oversold but No Relief Rally
The hourly chart paints an even grimmer picture. The RSI has plunged to 27.23, a deeply oversold reading. However, unlike typical oversold conditions that trigger a bounce, no rebound has occurred yet. This lack of recovery points to persistent selling pressure and weak short-term demand.
Market Sentiment and Wider Crypto Context
The overall crypto market is also under pressure. The Fear & Greed Index sits at 28, reflecting caution and panic among investors. The total crypto market capitalization has dropped 1.31% to around $2.27 trillion, showing broader weakness that impacts assets like Bittensor.
For Bittensor to escape its bearish trap, a daily close above $190 is essential, ideally accompanied by rising MACD and RSI momentum to signal a shift in control. Until then, the $185 area remains the last line of defense.
This material is for information only and does not constitute financial advice.