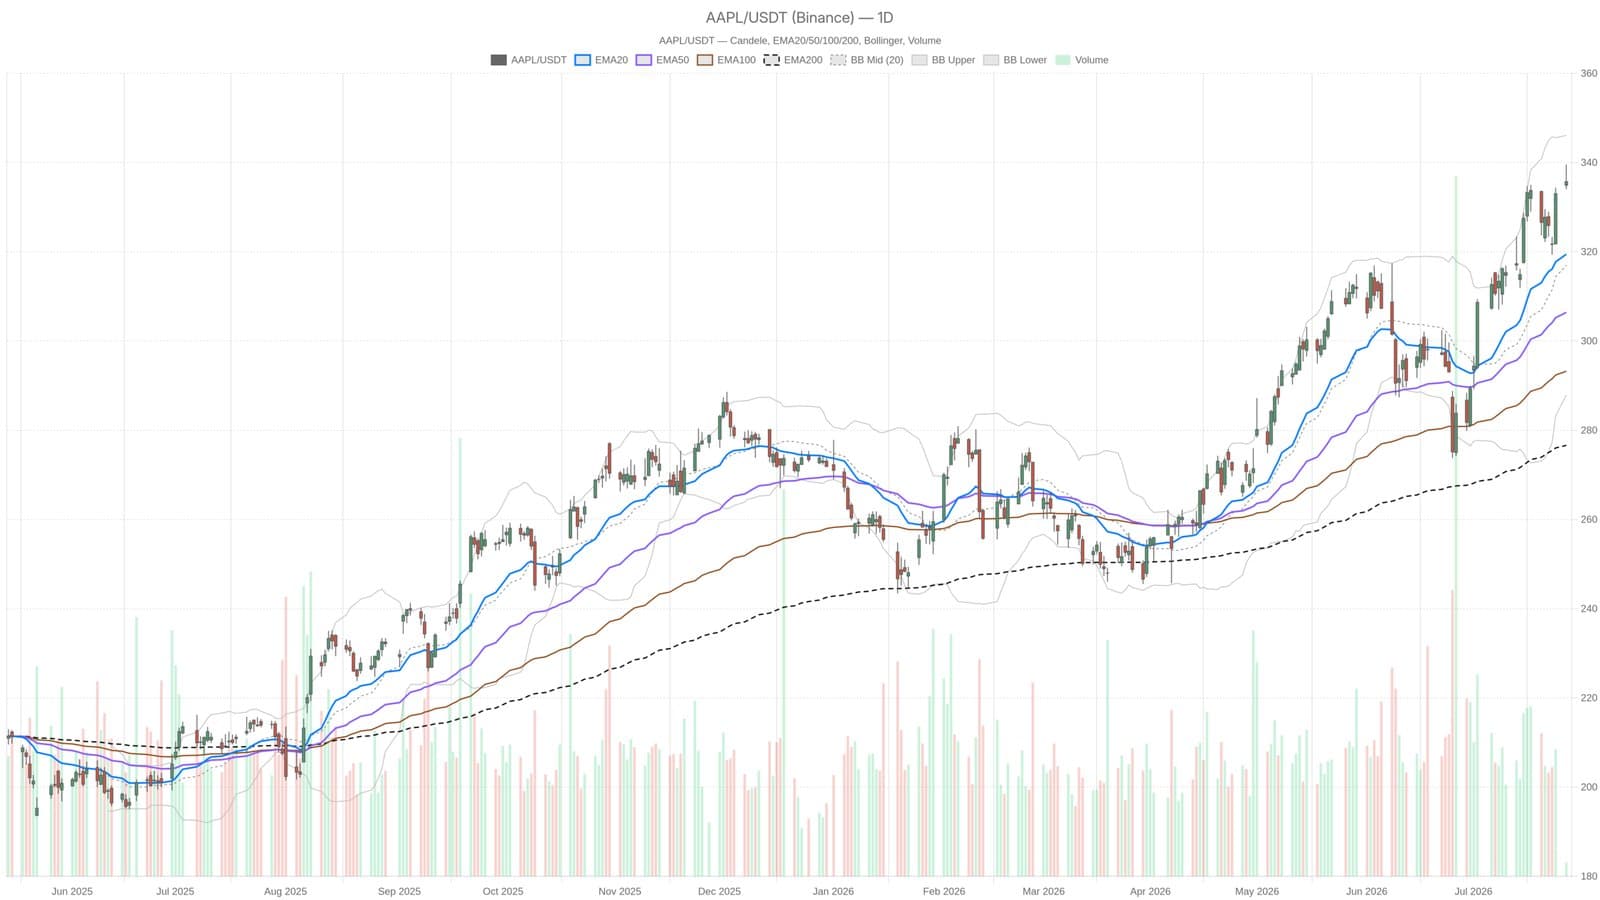
Apple's stock price hit $335.71 on July 27, climbing over 22% since the start of the year. This rally recently pushed Apple past Nvidia to become the planet's top-valued company by market capitalization.
Trading above its key moving averages the 20-day at $319.45, 50-day at $306.42, and 200-day at $276.62 the stock shows a persistent bullish trend that has unfolded over several months. The price action reflects steady accumulation rather than short-term volatility.
Technical indicators reinforce the strength of this momentum. The relative strength index (RSI) sits at 66.68, signaling solid buying interest without entering overbought territory. Meanwhile, the MACD line remains above its signal line with a positive histogram, affirming the ongoing upward trend.
Apple’s price currently hugs a daily pivot point at $336.43, with immediate resistance at $338.83 and support near $333.31. This indicates some market hesitation right before the company’s quarterly earnings announcement scheduled for July 30.
On an intraday level, the hourly charts confirm the bullish bias with dips attracting buyers consistently. This alignment across timeframes suggests investors are gearing up ahead of earnings, waiting for fresh catalysts to drive the next move.
The stock’s position within the Bollinger Bands comfortably in the upper half of the range between $287.87 and $346.10 also supports continued trending behavior rather than a pullback. The average true range (ATR) of 7.93 points to moderate volatility, enough for active trading but without erratic swings.
Market watchers will be watching Apple's July 30 earnings closely as it promises to trigger significant volatility given the stock’s strong technical setup. Investors face a binary event: positive results could extend the rally, while any disappointment may lead to sharp reversals.
With Apple’s solid performance this year, the company’s stock stands out as a key to watch in a market environment where tech and digital assets have captured investor attention.