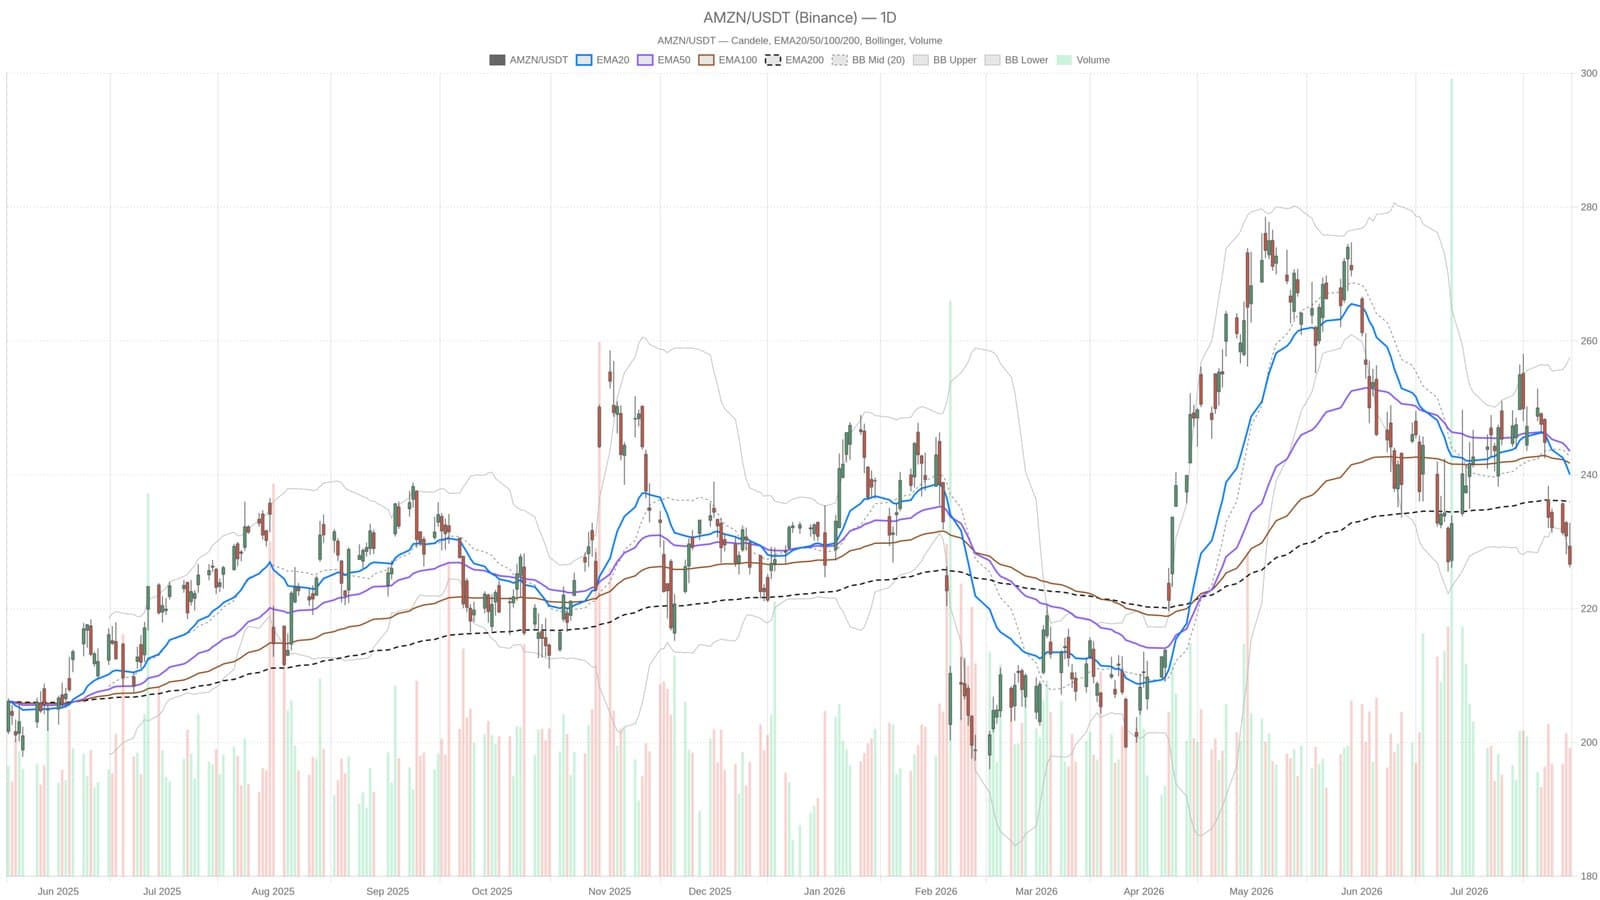
On July 29, Amazon’s stock closed at $226.65, slipping below key moving averages and testing the lower limit of its daily Bollinger Bands. This places the stock in a fragile technical position just before its Q2 earnings report set for Thursday afternoon.
The shares are trading beneath the EMA20 at $240.04, EMA50 at $243.53, and EMA200 at $235.98, signaling strong selling pressure across short, medium, and long-term trends. The RSI at 33.31 edges closer to oversold levels but hasn’t confirmed a reversal yet, hinting at continued distribution rather than a bounce back.
The MACD indicator intensifies concerns with a negative histogram at -1.99 and the MACD line at -3.75 below its signal at -1.76, reflecting deteriorating momentum. The breach under the Bollinger Band lower line at $227.84 indicates heightened volatility and an extended downside move, though it alone does not guarantee a rebound.
Analysts project AWS revenue growth in the range of 31% to 33% year-over-year for Q2. Meanwhile, CEO Andy Jassy has pledged $200 billion in capital expenditure through 2026, partly financed by a recent $25 billion bond issuance. These factors will be closely watched amid the stock’s bearish technical setup.
The average true range of $6.48 shows the significant daily price swings that can make trading Amazon shares costly in either direction. Investors face a technical crossroads with AMZN’s daily pivot at $228.54 and support level S1 at $224.27, setting the stage for a volatile earnings reaction.
This content is for informational purposes and does not constitute financial advice.